


Abstract
Functional neuroimaging investigations have revealed a range of age-related differences in the neural correlates of episodic memory retrieval. Typically, whereas activity is reduced in older compared with younger adults in some regions, other regions are engaged exclusively, or to a greater extent, in older adults. It is unclear whether such differences merely represent the neural correlates of the lower levels of memory performance and impaired recollection typical of older adults. This issue was addressed in the present event-related functional magnetic resonance imaging study. The level of recollection was matched between groups of healthy younger and older adults for a subset of picture items in a source memory task by manipulating the number of study presentations. Contrasts of the activity elicited by old items attracting correct source judgments and correctly identified new items revealed that the 2 groups recruited many of the same brain regions. However, a striking pattern of age-related differences was also observed. In older adults, retrieval-related increases in activity were more widespread and of greater magnitude than in the young. Moreover, regions demonstrating retrieval-related decreases in activity were almost absent in the older participants. These findings suggest an age-related decline in the efficiency with which neural populations support cognitive function.
Introduction
Memory decline in healthy older adults is characterized by difficulties in performing a variety of tasks, but the ability to remember the details of specific events—episodic memory—is particularly affected (Light 1991; Craik and Jennings 1992). Age-related effects are most marked when deliberate, explicit retrieval is required, performance on many indirect tests being spared with age (see Light 1996). Older adults' free recall of events is also more impaired than their recognition of the same information (e.g., Schonfield and Robertson 1966; Craik and McDowd 1987). A related finding is that the likelihood of recollection of the “source” or context of an item or event declines with increasing age, whereas performance based on a more general sense of familiarity is largely preserved (Parkin and Walter 1992; Spencer and Raz 1995; Yonelinas 2001). Neuroimaging studies have an important role to play in identifying age-related changes associated with episodic retrieval as opposed to encoding and in specifying the relevant retrieval processes (Rugg and Morcom 2005). The starting point of the present event-related functional magnetic resonance imaging (fMRI) study was the possibility that previously reported age-related differences may in part be due to the different levels of performance and engagement of different kinds of processing in older compared with younger adults. Its principal aim was to investigate how the neural correlates of recollection differ with age under conditions where retrieval processing and performance were matched as far as possible. To the extent that such matching is successful, this approach permits the question to be addressed of whether there are age-related differences in recollection-related neural activity in the absence of associated differences in performance.
Theoretical accounts of episodic retrieval implicate multiple cognitive processes in the search for, recovery of, and monitoring of episodic information (Tulving 1983; Burgess and Shallice 1996). Rugg and Wilding (2000) distinguished between 4 different putative categories of retrieval processing that can be differentiated using specific task contrasts. Three of these—retrieval mode, retrieval orientation, and retrieval effort—operate prior to the time that the stored episodic information is successfully reinstated. The fourth category of processes, those associated with “retrieval success,” includes cognitive operations associated with the recovery, representation, and subsequent processing of retrieved information.
Numerous studies have now examined the neural correlates of retrieval success in the young. Many of these have done so by comparing the level of regional activity elicited by successfully identified studied or “old” items to that elicited by correctly rejected unstudied or “new” items (Rugg and Wilding 2000). Such differential activity, referred to as an “old/new effect,” reflects processing associated with, or contingent upon, the successful retrieval of studied information. Measured thus, successful retrieval engages a network of neocortical and medial temporal lobe (MTL) regions (for review see Rugg et al. 2002). Recent findings suggest a role for dorsolateral prefrontal cortex (PFC), particularly on the right, in postretrieval “monitoring” (Henson et al. 2000). Given an experimental task that permits recognized study items to be segregated according to whether recognition is accompanied by the retrieval of episodic detail (recollection), it is possible to fractionate old/new effects further (Rugg 2004). Effects associated specifically with recollection tend be localized to left-sided lateral and anterior prefrontal regions, medial and lateral parietal cortices, and to the hippocampus and adjacent medial temporal cortices (Henson, Shallice, and Dolan 1999; Eldridge et al. 2000; Wheeler and Buckner 2004; Yonelinas et al. 2005; for reviews see Rugg et al. 2002; Henson 2005).
The earliest neuroimaging studies of the effects of aging on episodic retrieval employed blocked designs and so focused on age-related differences in brain activity associated with task-wise comparisons of retrieval versus “baseline” tasks with no retrieval component. Findings from these studies revealed a wide variety of age-related differences (for reviews see Grady and Craik 2000; Langley and Madden 2000; Cabeza 2002; Reuter-Lorenz and Lustig 2005). Perhaps most strikingly, in several studies increased activity was reported in older adults in regions that were seemingly not engaged in the young. Such findings were reported most frequently for PFC (Backman et al. 1997; Cabeza et al. 1997, 2002; Madden, Gottlob, and Allen 1999) but were sometimes observed in temporal or parietal regions as well (Cabeza et al. 1997; Grady et al. 2002; Schiavetto et al. 2002; see also Madden, Turkington, et al. 1999). In PFC, additional recruitment in older adults has been observed in regions contralateral to those engaged in the young, leading to the suggestion that aging may be associated with a reduction in functional lateralization (Reuter-Lorenz and Stanczak 2000; Cabeza 2002). There have also been reports of attentuated responses in older adults in regions that showed increased activity in the young, notably in lateral (Cabeza et al. 1997) or anterior (Schacter et al. 1996; Grady 2002) PFC.
In the first event-related functional neuroimaging study to investigate age-related differences in activity specific to episodic retrieval, Daselaar et al. (2003) reported that old/new effects in a verbal yes/no recognition task did not differ reliably between young adults and a high performing older group who demonstrated equivalent recognition performance. However, a lower performing older group showed a relative enhancement of retrieval-related activity in left lateral PFC. More recently, Daselaar et al. (2006) have reported age-related differences in activity in medial temporal and posterior cortical regions that are consistent with an age-related decrease in the extent to which successful recognition memory is supported by recollection.
Together, the foregoing findings are suggestive of age-related changes in the neural correlates of successful retrieval but are hard to interpret unambiguously. Findings of increased recruitment in older adults have led to suggestions that they may engage the brain differently during episodic memory (and other) tasks, manifesting changes at the neural level described as age-related “dedifferentiation” and/or “compensation” (Grady et al. 1995; Cabeza et al. 1997; Cabeza 2002; Logan et al. 2002). However, these age-related changes in neural correlates may simply reflect the differential engagement of component cognitive processes supporting different levels of task performance. Blocked comparisons are inherently ambiguous in that it is not possible to segregate the data according to these different aspects of retrieval processing. And in the context of event-related designs, age-related differences in performance may still compromise the interpretation of differences in neural activity. One reason for this comes from the “diluting” effects of guesses. As performance declines in retrieval tasks like yes/no recognition, the proportion of correct responses due to “lucky guesses”—which elicit no activity due to retrieval success—increases, leading to an apparent age-related diminution of retrieval effects. Even when overall performance is equated, a problem remains if performance is supported by multiple processes, as in the case of recognition memory. For example, if successful recognition in older adults is associated with lower levels of recollection than in the young, age-related differences in the neural correlates of successful retrieval may represent no more than differences between recollection- and familiarity-based responding (see Rugg and Morcom 2005). Thus, although qualitatively different patterns of activity have been reported in older compared with younger adults, it is presently unclear to what extent these differences are secondary to the differential engagement of component retrieval processes in the 2 groups. In the aforementioned study of Daselaar et al. (2006), for example, trial-wise variation in recollection and familiarity was associated with different patterns of activity in older compared with younger adults. However, whereas overall recognition performance was equated between older and young subject groups, the relative contributions of recollection and familiarity were not; estimates of the contributions of the 2 processes differed between groups. Therefore, performance-related factors such as dilution may account for some of the group differences reported.
The present study aimed to identify the effects of age on the neural correlates of successful episodic retrieval, unconfounded by neural activity associated with “preretrieval” processes or age-related differences in task performance. To ensure that retrieval success was associated with equivalent levels of recollection in older and younger groups, the critical contrasts examined old/new effects restricted to recollected old items. Recollection was indexed by the successful identification of information about the source of previously studied items, and the probability of recollection was matched across age groups. This was accomplished using the same encoding manipulation that was employed in a parallel event-related potential (ERP) study (Li et al. 2004).
Materials and Methods
Participants
Participants included in the analysis were 32 healthy, right-handed adults, 16 from the age range 18–29 years (mean 23.0 years [data only available for 13 young participants]) and 16 from the age range 62–74 years (mean 68.3 years). Of the younger age group, 8 were men, and of the older age group, 4 were men. One additional older participant was excluded before scanning on the basis of inadequate neuropsychological test performance (see below). A young participant was excluded after fMRI scanning because of source accuracy scores suggestive of performance no better than chance. Three further participants (1 young and 2 older) were excluded because of scanner or procedural problems. Participants were undergraduate and postgraduate students and high-functioning community dwelling individuals. As Table 1 indicates, the 2 groups were matched for verbal intelligence quotient (IQ), although the younger group had received more formal education (see Discussion). All participants were right-handed, and their first language was English. All had normal or corrected-to-normal (using scanner-compatible spectacles [these were required in more of the older than the younger participants, although precise numbers are not available]) vision. Volunteers were excluded from participation if they were taking any central nervous system-active or vasoactive medication or if they reported significant neurological, cardiovascular, psychiatric, or systemic illness. Informed consent was obtained prior to participation, and the experimental procedures were approved by the Joint University College London and University College London Hospital Committees on the Ethics of Human Research and by the Institute of Neurology and National Hospital for Neurology and Neurosurgery Joint Research Ethics Committee.
Participant characteristics by age group, and performance on standardized neuropsychological tests
| Younger | Older | P | |
| Age | |||
| Years of education (from 16 years) | 4.1 (1.4) | 2.1 (2.9) | <0.05 |
| National Adult Reading Test Full Scale IQ estimate | 113 (5.5) | 117 (8.9) | n.s. |
| Raven's Advance Progressive Matrices II | 11.6 (1.0) | 9.6 (1.7) | <0.001 |
| Mini Mental State | — | 29.1 (0.8) | — |
| Warrington–McKenna Graded Naming | 23.1 (3.0) | 25.6 (2.9) | <0.05 |
| Wecshler Adult Intelligence Scale digit span | 9.4 (1.8) | 8.9 (2.6) | n.s. |
| Verbal paired associates (WMS)—immediate | 21.6 (1.3) | 19.1 (2.7) | <0.005 |
| Verbal paired associates (WMS)—delayed | 7.9 (0.4) | 7.7 (0.5) | n.s. |
| Short story recall (AMIPB)—immediate | 44.1 (6.0) | 37.6 (6.6) | <0.01 |
| Short story recall (AMIPB)—delayed | 43.4 (6.4) | 36.1 (7.1) | <0.01 |
| FAS verbal fluency | 46.3 (10.4) | 46.9 (21.6) | n.s. |
Note: Mean scores are shown, with standard deviations in parentheses. P values reflect the results of t tests, except in the case of years of education, digit span, and paired associates measures, where they reflect the results of Mann–Whitney U tests. AMIPB: Adult Memory and Information Processing Battery, n.s.:not significant.
Neuropsychological Testing
All participants were administered a battery of standardized neuropsychological tests to assess intelligence, memory, and language in a separate 1.5-h session prior to the MRI scanning session. The battery, described in more detail elsewhere (Morcom et al. 2003), tapped both cognitive functions that are impaired with age and others that are typically spared. As a screening measure, for the older participants, a minimum score of 26/30 on the Folstein Mini Mental State examination was required for inclusion in the study (Folstein et al. 1975; Lezak 1995). The rest of the battery comprised the National Adult Reading Test (Nelson 1982), the Raven's Advanced Progressive Matrices II (untimed; Spearman 1927; Raven et al. 1994), the Digit Span Forward (from the Wechshler Memory Scale—Revised [WMS-R], Wechsler 1987), the Warrington–McKenna Graded Naming test (Clegg and Warrington 2000), the FAS verbal fluency test (Lezak 1995), the Adult Memory and Information Processing Battery Logical Memory short story recall test (immediate and delayed; Coughlan and Hollows 1985), and the WMS-R Verbal Paired Associates test (Wechsler 1987). One older participant was excluded from the study after the neuropsychological testing session because of difficulty understanding and following the task instructions.
Stimulus Materials
The lists of critical stimuli were constructed from a pool of 240 color pictures of objects. Each represented a photograph of a single item in a standard view against a gray background. For each matched pair of one younger and one older participant, 6 lists of 40 pictures each were formed by random selection from this pool, with the constraint that the distribution of encoding task-related characteristics (i.e., size and animacy) would be same in each. Of the 6 lists, 4 were used as studied items (2 for size judgments and 2 for animacy decisions) and the other 2 were used as new items at test.
Study blocks were created by arranging items in pseudorandom order such that the same judgment task would not occur on more than 3 consecutive trials. To match the performance between the age groups, source memory difficulty was manipulated by varying how often the items were presented at study. Pilot work, and a preceding ERP study (Li et al. 2004), indicated that source memory accuracy was equivalent in the 2 age groups when items were studied 2 times by the young and 3 times by the older participants. Items from one size decision list and one animacy decision list were therefore presented once for both age groups (hard condition), whereas those from the other 2 lists were repeated either 2 or 3 times (with a minimum of 10 intervening stimuli) according to age group (easy condition). The repeated and nonrepeated items were intermixed in 3 or 4 study blocks for young and older participants, respectively, each block comprising 80 critical items plus 2 additional items as fillers at the beginning. An additional 16 pictures formed 2 practice lists for the study task.
Test blocks comprised a pseudorandom ordering of items from the 4 studied and the 2 new lists, along with 80 fixation-only trials, such that no more than 3 events of a given type (studied, unstudied, or fixation) would occur in a row. This test sequence was divided into 4 blocks of 80 trials and 2 fillers added at the beginning of each block. Eight additional unstudied items were combined with the 16 studied items to create 2 practice lists for the test task.
Experimental Tasks and Procedure
The experimental procedure consisted of 2 intermixed incidental study tasks followed after an interval of about 5 min by a source memory test. Before the experiment properly began, 2 short study test practice cycles were administered. Participants were then positioned in the scanner before commencing the study phase, although scanning took place during the test phase only. All the pictures were presented within a white frame in the center of a black background, projected onto a screen approximately 60 cm behind the participants, which was viewed via a pair of mirrors placed above the eyes. The frame subtended a visual angle of approximately 5° horizontally and vertically. Pictures were shown in color, and cue words (see below) were shown in white lower case Helvetica font and subtended a vertical visual angle of 4–5°.
During the study phase, items were displayed for 1.5 s, following the presentation of a cue word for 1.5 s. When the cue was “Size?,” participants decided whether, in real life, the object would fit into a shoebox. When the cue was “Living?,” they decided whether the object was a living or a nonliving thing. Participants were instructed to give verbal responses indicating firstly their judgment of the item and secondly its name. In this way, the experimenter was able to determine whether the correct task was performed on each trial and whether the items were seen clearly enough to be identified. Trial timing was paced by the participant, the presentation of the cue for the next trial being triggered by a button press. Short rests were given between blocks. Participants were informed that their memory both for the pictures and for the corresponding decisions would be tested subsequently. The duration of the study blocks was approximately 21 min for the young participants and 28 min for the older participants.
In the test phase, a fixation “+” sign was present in the center of the screen at all times. This was white between stimulus presentations but changed to red 1200 ms before the onset of each picture. The red fixation sign then remained on the screen with the picture. Each picture was presented for 500 ms, and the intertrial interval was 5 s. On “fixation-only” trials, the white fixation sign simply persisted for the duration of the trial. Participants were asked to decide whether they had previously seen each picture and made a size decision, whether they had previously seen it and made a living–nonliving decision, or whether the picture was new. They responded with a button press by the middle and index fingers of one hand and the index finger of the other hand, respectively. The assignment of hands to responses was counterbalanced across participants. Participants were instructed to respond as quickly and accurately as possible and to respond new if unsure whether an item was old or new. They were also requested to keep as still as possible and to maintain fixation on the + sign at all times. Three short rest breaks were given, after every 82 items. Following the test phase, participants underwent a 15-min structural scan. Once out of the scanner, all new items were re-presented to the participants at a self-paced rate, permitting identification and rejection from analysis of new items that had not been perceived correctly during the test phase. This was to ensure as far as possible that items entering into the fMRI analysis had all been identified by the participants.
fMRI Procedure
Data Acquisition
Both T1-weighted anatomical volume images and T2*-weighted echoplanar images (EPIs) (64 × 64–mm pixels, 3 × 3–mm pixels, echo time = 40 ms), with blood oxygenation level–dependent (BOLD) contrast, were acquired using a 1.5-T Siemens SONATA system (Siemens, Erlangen, Germany). Each EPI volume consisted of 32 × 2.5-mm-thick axial slices separated by a 1.5-mm gap positioned for full coverage of the cerebrum but not of the cerebellum. Acquisition of 539 volumes took place continuously during a single session, with a repetition time of 2.52 s/volume. The first 5 volumes were discarded to allow for T1 equilibration effects. The constant interstimulus interval of 4 s allowed an effective sampling rate of the hemodynamic response of 2.8 Hz.
Preprocessing
Preprocessing and data analysis were carried out using Statistical Parametric Mapping (SPM2, Wellcome Department of Cognitive Neurology, London, UK (Friston et al. 1995, http://www.fil.ion.ucl.ac.uk/spm/software/spm2). For each volunteer, all volumes in a session were realigned spatially to the first volume and resliced using B-spline interpolation in space. To correct for their different acquisition times, the signal measured in each slice was then shifted relative to the acquisition of the middle slice using a sinc interpolation in time. Inspection of movement parameters generated during spatial realignment indicated that no participant moved more than 2 mm or 2° in any direction during task performance and that the 2 age groups did not differ systematically in this respect. Each volume was normalized using nonlinear basis functions and resampled into 3 × 3 × 3–mm voxels using a standard EPI template volume based on the Montreal Neurological Institute (MNI) reference brain (Cocosco et al. 1997) in the space of Talairach and Tournoux (1988) (Ashburner and Friston 1999) The T1 structural volume was coregistered with the mean realigned EPI volume and normalized with the same deformation parameters. The EPI volumes were then smoothed with a 10-mm full-width half-maximum isotropic Gaussian kernel to allow for anatomical variation between as well as within the 2 age groups (Good et al. 2001; see Morcom et al. 2003). The data were high-pass filtered to a maximum of 1/128 Hz, and no low-pass filter was used.
Data Analysis
Population inferences were made using a 2-stage “summary statistic” procedure. In the first stage, the volumes acquired for each participant were modeled as a continuous time series. Trials at test were classified into 5 main event types. For each of the easy and the hard conditions, there were 2 categories of previously studied items, “source correct” (those attracting a correct source judgment) and “source miss” (those correctly identified as old but attracting an incorrect source judgment). Finally, “correct rejections” (CRs) were correctly classified new items. Items studied in the size task and those studied in the living/nonliving task were modeled separately, but these conditions were collapsed together for all analyses presented here. Those items not identified or wrongly classified during the study phase, or not identified after the test (see Materials and Methods), were modeled as events of no interest in the fMRI analysis along with the error trials, regardless of response accuracy. In the young and older groups, respectively, 5% and 23% of studied items and 1% and 7% of new items were excluded for these reasons. The hemodynamic response to the onset of each event type of interest was modeled with 2 basis functions, a canonical hemodynamic response function (HRF; Friston et al. 1998) and a delayed HRF (Henson et al. 2000), shifted 2.5 s later in time than the canonical HRF. The employment of “early” and a “late” response functions was motivated by 2 considerations. Firstly, in several studies of episodic retrieval in young adults, maximal activation in regions such as the anterior PFC may be delayed relative to the sensory regions on which the canonical HRF is based (Schacter et al. 1997; Buckner et al. 1998; Henson et al. 2000). Secondly, either cognitive slowing or vascular changes in older adults might introduce age-related differences in the timing of BOLD responses to events. It should be noted, however, that reported differences in the shape and timing of the BOLD event-related response have been minor and inconsistent (e.g., D'Esposito et al. 1999; Huettel et al. 2001).
Sequences of delta functions representing the onsets of events for each trial type were convolved with the early and the late response functions to form the covariates in a general linear model, together with a constant term for each participant. The covariates for the late HRF were orthogonalized with respect to those for the early HRF using a Gram–Schmidt procedure, giving priority to the early covariate (Andrade et al. 1999). Variance common to the early and late covariates was thus attributed to the early covariate, so that loadings on the orthogonalized late covariate accounted only for residual variance in the data unexplained by the early covariate. Parameter estimates for each covariate were calculated from the weighted least squares fit of the model to the data, following prewhitening based on an AR(1) plus white noise model to remove autocorrelations in the time series (Friston et al. 2002). The data for each session were proportionally scaled to a global mean of 100. Also included for each participant were 6 covariates to capture residual movement-related artefacts (the 3 rigid body translations and rotations determined from the realignment stage).
In the second stage of the analysis, planned linear contrasts of parameter estimates for both early and late covariates were computed for the combinations of conditions specified in Results. These contrasts were stored as separate images for each participant and entered into second level or “random effects” models, permitting inferences about condition effects across participants and between groups that generalize to the population. A weighted least squares estimation procedure was employed that accounted for nonsphericity, including unequal variance between groups. The contrasts produced statistical parametric maps of the t statistics at each voxel, which were subsequently transformed to the unit normal Z distribution. Unless otherwise specified, results reflect 1- and 2-sample t tests, computed for both directions of a contrast (although individual comparisons are directional). Inclusive masks were applied at an uncorrected threshold of P < 0.001 and exclusive masks at an uncorrected threshold of P < 0.05. The contrasts (masked or unmasked) were thresholded at P < 0.001, uncorrected for multiple comparisons, with a minimum cluster size of 5 voxels. The locations of maxima of suprathreshold regions were established by rendering them onto both the volunteers' normalized structural and mean EPIs and the MNI reference brain (Cocosco et al. 1997). They were labeled using the nomenclature of Talairach and Tournoux (1988) and anatomical designations of Brodmann (1909).
Results
Neuropsychological Test Performance
The results of the neuropsychological test battery are summarized in Table 1 (incomplete data were obtained from 2 younger participants who attended only for one session). The results indicate that although the older group had received fewer years of formal education than the young, the 2 age groups did not differ reliably in verbal IQ as estimated by performance on the National Adult Reading Test. Nonetheless, both long-term memory performance and fluid IQ, as measured by the Raven's Advanced Progressive Matrices, were, as expected, significantly lower in the older relative to the younger group.
Behavioral Performance
The behavioral performance data are summarized in Table 2 and Figure 1. Item recognition was defined as the proportion of studied items judged old regardless of source accuracy and measured using the discrimination index Pr (P(hit) − P(false alarm) (Snodgrass and Corwin 1988). An analysis of variance (ANOVA) with factors of group (younger/older) and difficulty (easy/hard) on these data revealed a significant interaction of group with difficulty (F(1,30) = 5.01, P < 0.05; for easy condition, mean Pr = 0.96 [SD = 0.03] in the young and 0.93 [SD = 0.05] in the older group, and for hard condition, 0.93 [SD = 0.06] and 0.85 [SD = 0.09], respectively) and main effects of both group (F(1,30) = 10.11, P < 0.005; means [SDs] = 0.95 [0.04] and 0.89 [0.06] for young and older, respectively) and difficulty (F(1,30) = 31.40, P < 0.001; means [SDs] = 0.95 [0.04] and 0.89 [0.09] for easy and hard, respectively). Follow-up pairwise contrasts showed reliable group differences in both the easy and the hard conditions (T(30) = 2.52, P < 0.05; T(30) = 3.10, P < 0.005, respectively). The interaction reflected the fact that the group difference was larger in the hard than in the easy condition. As the easy and hard conditions were intermixed, with a common set of new items, it is not possible to estimate separate response criteria for the 2 conditions. For the 2 combined, the nonparametric index Br (Snodgrass and Corwin 1988) did not differ between the 2 age groups (T < 1, not sisnificant; mean Br in the younger and older groups = −0.44 [SD = 0.38] and 0.45 [0.30], respectively).
Memory task performance
| Younger | Older | ||
| Accuracy (proportion) | |||
| Old items | Easy—correct item | 0.99 (0.01) | 0.98 (0.02) |
| Easy—correct source | 0.82 (0.06) | 0.84 (0.09) | |
| Hard—correct item | 0.96 (0.05) | 0.90 (0.07) | |
| Hard—correct source | 0.76 (0.06) | 0.69 (0.06) | |
| New items | CR | 0.97 (0.03) | 0.94 (0.05) |
| False alarm | 0.03 (0.03) | 0.06 (0.05) | |
| RTs (ms) | |||
| Old items | Easy—correct source | 1623 (297) | 1584 (381) |
| Hard—correct source | 1766 (294) | 1933 (451) | |
| New items | CR | 1154 (237) | 1251 (261) |
Note: Mean scores are shown, with standard deviations in parentheses.
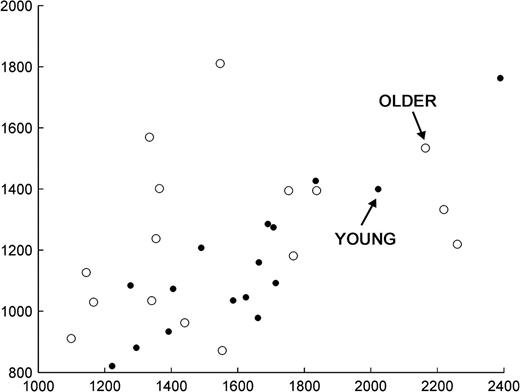
Response times for easy source hits and CRs. Each data point represents one young (filled circles) or older (unfilled circles) participant. Values on the x axis are each participant's mean RT for easy condition old items whose source was correctly identified, and values on the y axis are each participant's mean RT for correctly rejected new items.
Source accuracy was measured as the proportion of studied items judged old (i.e., accorded either a correct or incorrect source judgment) that were assigned to the correct source. ANOVA of these data gave rise to a significant interaction between the difficulty and group factors (F(1,32) = 6.50, P < 0.05), a main effect of difficulty (F(1,30) = 55.34, P< 0.001), but no main effect of group, F < 1. Follow-up contrasts revealed no group effect for the easy condition (F < 1; see Table 2) but a significant effect for the hard condition, in which source accuracy was lower in the older participants (F(1,30) = 6.65, P < 0.05). Thus, the interaction reflected a reliable reduction in source memory in the older group only in the hard condition.
Table 2 also shows reaction times (RTs) for items attracting correct responses, and Figure 1 shows their distribution in the easy condition with respect to those for CRs. ANOVA for source hit data had factors of group (young/older) and condition (easy/hard source correct) and gave rise to a reliable interaction of group with condition (F(1,30) = 14.26, P < 0.001) and a main effect of condition (F(1,30) = 81.42, P < 0.001) but no main effect of group (F < 1). The interaction reflected faster responses by the older than the young group for easy source hits (by 39 ms) and the reverse pattern in the hard condition (by 167 ms), although group differences were not reliable for either condition taken alone. RTs for new items were faster for both groups than those for easy hits, and RTs for easy hits were faster than those for hard hits. For CRs, ANOVA demonstrated no reliable effect of group (F < 1). As can be seen from the scatter plot in Figure 1, the relationship between RTs for easy hits and for CRs was broadly similar in the 2 age groups, although somewhat more tightly coupled in the younger group. Most importantly for present purposes, the distributions show substantial overlap. Thus, between-group differences in the neural correlates of recollection (see below) are unlikely merely to reflect differences in RT to the critical test items.
Overall, the pattern of the behavioral findings closely resembles that obtained with the same task procedures in the ERP study of Li et al. (2004).
fMRI Findings
The strategy employed in the fMRI data analysis was to examine age-related differences and commonalities in the neural activity associated with successful source retrieval while avoiding, as far as possible, confounds associated with relatively poorer performance in older participants. The most important comparisons were therefore those for the easy condition, in which performance was closely equated between the 2 age groups. Effects for the hard condition are interpreted mainly in terms of their bearing on the results of this primary analysis. Contrasts compared the activity associated with successful source retrieval (source hits) relative to CRs of new items. (Contrasts between source hits and source misses are not reported as there were insufficient trials reliably to estimate activity associated with the misses, due to the high level of source memory in both age groups.) Importantly, and in contrast to the study of Daselaar et al. (2006), the approach adopted permitted the identification of regions where recollection effects took the form of relative decreases in activity (CR > hits), as well as increases (hits > CR) and regions where age-related differences in these effects took the form of a crossover interaction.
There were 2 principal sets of comparisons for the easy condition. The first explored old/new effects common to young and older adults. Inclusive masking of contrasts computed independently in the 2 age groups was employed to identify voxels conjointly active at the chosen threshold. This overlapping of the statistical maps yields regionally significant effects that are significant in both groups, but the Z values and the loci of the peak voxels pertain to the masked contrast rather than the mask. Contrasts from the young and the older group therefore served in turn as mask and masked in order to identify the 2 sets of peaks within the conjoint clusters (details are reported in Table 3). The inclusively masked contrasts were then exclusively masked with the group × old/new interaction contrasts (see below) to eliminate voxels where effects differed in magnitude between the groups.
Easy condition: age-invariant old/new effects
| Location in young (x, y, z) | Peak Z in young | Location in older (x, y, z) | Peak Z in older | N in cluster | Region | Brodmann area |
| Easy hits > CRs | ||||||
| −27, −66, 45 | 5.52 | −36, −54, 45 | 5.59 | 943 | Left inferior/superior parietal lobule | BA 40/7 |
| This cluster also includes subpeaks | ||||||
| −21, −63, 33 | 5.27 | −39, −72, 51 | 5.19 | Left superior parietal lobule | BA 7 | |
| −6, −72, 30 | 5.25 | 9, −69, 45 | 4.88 | Medial parietal/precuneus | BA 7/31 | |
| −24, 6, 54 | 4.90 | −27, 9, 54 | 4.10 | 138 | Left superior frontal gyrus | BA 6 |
| −51, 27, 30 | 4.80 | −39, 24, 33 | 5.72 | 648 | Left middle frontal gyrus | BA 9/45 |
| This cluster also includes subpeaks | ||||||
| −39, 3, 42 | 4.46 | −45, 18, 27 | 5.33 | Left middle frontal gyrus | BA 8/6 | |
| −45, 6, 27 | 3.92 | −51, 12, 36 | 4.85 | Left inferior frontal/precentral gyrus | BA 6/4 | |
| −48, 33, 12 | 3.73 | −39, 45, 12 | 4.59 | Left inferior frontal gyrus | BA 47 | |
| −42, 48, −3 | 3.72 | −48, 48, −3 | 4.79 | Left anterior middle frontal gyrus | BA 10 | |
| −6, 15, 54 | 4.37 | 3, 18, 54 | 3.56 | 53 | Medial superior frontal gyrus | BA 6 |
| 30, 0, 60 | 3.99 | 30, 3, 57 | 3.73 | 9 | Right middle frontal gyrus | BA 6 |
| 0, −75, −3 | 3.81 | 0, −78, −3 | 3.97 | 6 | Lingual gyrus | BA 18 |
| 0, −12, 60 | 3.42 | 0, −9, 60 | 3.36 | 6 | Medial superior frontal gyrus | BA 6 |
| CRs > easy hits | ||||||
| 33, −84, 12 | 5.24 | 33, −87, 12 | 3.53 | 6 | Right middle occipital gyrus | BA 18 |
Note: Regions tabulated show significant (P < 0.001, cluster size > 5) signal increases for easy condition source hits versus CRs on the early covariate, common to both age groups, and exclusively masked with the age-related interactions. Separate peaks in the 2 groups reflect the inclusive masking procedure described in the text. N refers to the number of significant voxels in each cluster; Z refers the Z statistic value for each peak or subpeak; and x, y, and z refer to distances in millimeter from the origin in MNI space (see Materials and Methods).
The second set of contrasts identified age-related differences in the magnitude of old/new effects. This was achieved by computing the interactions of these effects with the factor of age group. The interaction contrasts tested firstly for regions in which old/new effects were greater in the young than in the older group (i.e., larger effects for hits > CR effects and/or smaller effects for CR > hits) and secondly for regions where old/new effects were smaller in the young.
The same methods were employed for contrasts of old/new effects in the hard condition. Then, inclusive masking of easy and hard condition old/new effects was carried out to determine which old/new effects were conserved across the 2 difficulty conditions (note that orthogonal contrasts are not required for this test for overlapping effects; both easy and hard source hits were compared with CRs). Because the performance-matched easy condition was of primary interest, contrasts for this condition were designated as the to-be-masked contrasts and those for the hard condition as the masks. Where old/new effects common to both age groups as well as to both difficulty conditions were of interest, the contrasts for easy hits versus CRs in the young were chosen as the to-be-masked contrasts. These were inclusively masked with contrasts of hard old/new effects in the young, both easy and hard old/new effects in the older group, and then exclusively masked with the group × old/new interaction contrasts from both difficulty conditions to discount any voxels showing effects that differed in magnitude between age groups. Likewise, for interactions of age group × old/new effects, the masked contrasts revealed regions showing age-related differences in easy old/new effects that were also significant in the hard condition.
Finally, planned comparisons were conducted on data from a limited set of voxels of interest to test the hypothesis that the retrieval effects are less strongly lateralized in older compared with younger participants (see Introduction).
The whole-brain analyses for the late covariate generally identified a subset of the same regions that loaded on the early (canonical) covariate. Although these analyses also identified some regions additional to those found with the early covariate, the findings do not modify the conclusions to be drawn on the basis of that anlaysis. The outcome of the analyses using the late covariate is available from the first author on request.
Old/New Effects Common to Both Age Groups in the Easy Condition
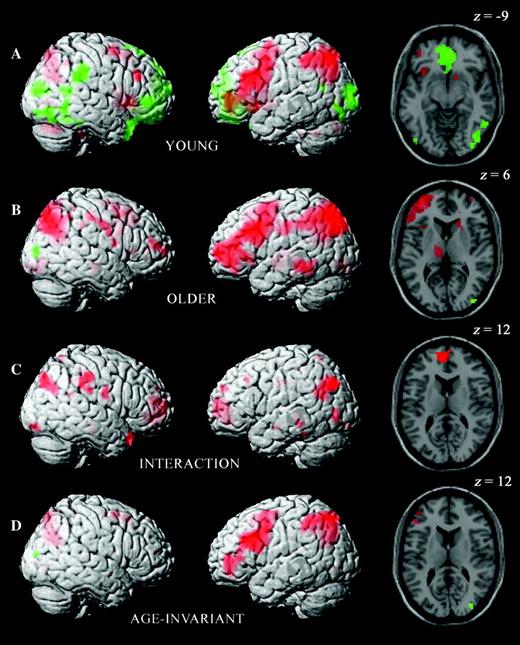
Inclusive masking across age groups of the contrast between easy source hits and CRs revealed an extensive network of regions where activity was greater for hits, as summarized in Table 3 (see also Figs 2 and 3). This predominantly left-sided network included regions in inferolateral, dorsolateral, and anterior lateral PFC, as well as lateral and medial parietal cortices (Fig. 2D). The reverse contrast (see Table 3) identified only a single region, in right lateral occipital cortex.
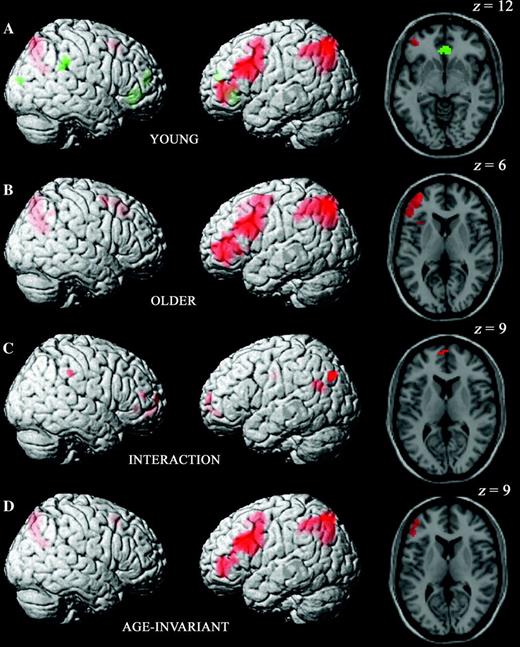
Differential activity within and across age groups for easy condition source hits versus CRs, rendered onto the MNI reference brain. Representative effects are also displayed on transverse sections of the same reference brain. Positive old/new effects are shown in red and negative old/new effects in green, with the exception of the interaction map. Here, red indicates regions in which activity for source hits minus CRs is greater in the older group. (A) Old/new effects in the young group alone. (B) Old/new effects in the older group alone. (C) Age-related differences in old/new effects. (D) Age-invariant old/new effects. The maps in (A) were inclusively masked with those in (B), with the interactions illustrated in (C) removed by exclusive masking (see Materials and Methods for details).
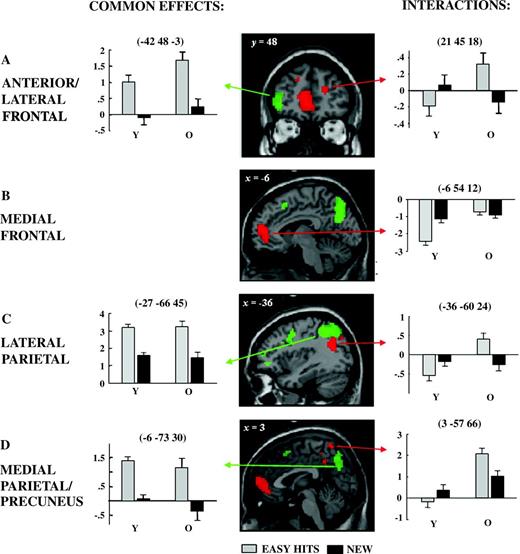
Age-related interactions and age-invariant old/new effects in selected regions. In (A–D), age-invariant effects are shown in green and age-related interactions in red (for definitions see Fig. 2 and Materials and Methods), and both are displayed on sections of the MNI reference brain. Graphs show the difference at peak voxels averaged across participants for easy source hits minus CRs (arbitrary units). Error bars represent the between-subject standard error.
Age differences in Old/New Effects in the Easy Condition
The contrasts of retrieval effects according to age for the easy condition revealed differential activity in a number of regions, which are listed in Table 4. These regions included medial anterior PFC, as well as more lateral anterior and right inferolateral prefrontal regions. Activity in the 2 groups also differed reliably in precuneus and cingulate regions; in bilateral posterior lateral parietal, temporoparietal, and lateral occipital cortices; and in the right temporal pole. Within the MTL, there were group differences in the left anterior MTL in the vicinity of the hippocampus/amygdala and in a right posterior region. Notably, although all these regions showed a larger old/new effect effect in the older group than in the younger group, no region demonstrated a larger effect in the young group (at the chosen threshold).
Easy condition: age-related differences in old/new effects
| Location (x, y, z) | Peak Z (N) | Region | Brodmann area |
| Old > young for easy hits > CRs | |||
| −36, −60, 24 | 4.50 (144) | Left inferior parietal lobule/superior occipital gyrus | BA 40/19 |
| −6, 54, 12 | 4.18 (292) | Medial anterior frontal cortex | BA 10 |
| 42, 21, −27 | 4.15 (22) | Right superior temporal gyrus (near pole) | BA 38 |
| 60, −27, 45 | 4.11 (55) | Right inferior parietal lobule/postcentral gyrus | BA 40/2 |
| 39, −78, 45 | 4.04 (27) | Right inferior parietal lobule/superior occipital gyrus | BA 40/19 |
| −15, 51, 30 | 4.34 (12) | Left superior frontal gyrus | BA 9 |
| 3, −57, 66 | 3.74 (14) | Precuneus | BA 7 |
| 15, −93, −12 | 3.71 (20) | Right extrastriate | BA 18 |
| 33, −87, −15 | 3.59 (9) | Right inferior occipital gyrus | BA 18 |
| −21, −9, −15 | 3.74 (14) | Left anterior hippocampus | |
| 18, 39, −3 | 4.23 (14) | Right middle frontal gyrus | BA 10/11 |
| −42, −39, −21 | 3.99 (8) | Left fusiform gyrus | BA 37/36 |
| 57, −9, 24 | 4.05 (21) | Right precentral gyrus | BA 4/6 |
| 21, 45, 18 | 3.88 (25) | Right anterior middle frontal gyrus | BA 10/9 |
| −12, −12, 36 | 3.47 (24) | Left cingulate | BA 24 |
| 15, −30, 45 | 4.04 (54) | Right cingulate/paracentral lobule | BA 31/5 |
| 39, −48, 24 | 3.47 (10) | Right inferior parietal lobule | BA 40 |
| −54, −75, 3 | 3.60 (10) | Left middle occipital gyrus | BA 19 |
| −66, −36, −9 | 3.39 (6) | Left middle temporal gyrus | BA 21 |
| 3, −48, 42 | 3.34 (19) | Posterior cingulate | BA 31 |
| −27, 24, 29 | 3.22 (7) | Left middle frontal gyrus | BA 8/9 |
| 21, −24, −12 | 3.26 (12) | Right posterior parahippocampal gyrus | BA 28 |
| −33, 57, 3 | 3.31 (7) | Left anterior middle frontal gyrus | BA 10 |
Note: Regions tabulated show significant (P < 0.001, cluster size > 5) group differences in differential activity on the early covariate for easy condition source hits versus CRs. See Table 3 for notes on other abbreviations.
Figure 2C illustrate the principal regions where age-related differences in easy condition retrieval success effects were detected. A subset of these are highlighted in Figures 3A–D, along with plots of parameter estimates to elucidate the form of the interactions. In many regions, these interaction effects took the form of a crossover, such that source hits elicited lower activity than CRs in the young but higher relative activity in the older participants. In some regions, however, one of these effects predominated. For example, in the medial anterior PFC, right temporal pole, and left anterior medial temporal region, the principal finding was of decreases for source hits relative to new items in the young but of no discernable effects in the older group. By contrast, activity in the precuneus, bilateral anterior PFC, right lateral occipital cortex, left middle temporal gyrus, anterior cingulate, and bilateral medial temporal structures showed prominent increases for source hits relative to CRs in the older group but little differential activity in the young. As can be appreciated from the figures, several of these latter regions were adjacent to those showing common effects.
Age-Invariant Old/New Effects in the Hard Condition
Inclusive masking across age groups of the contrast between hard source hits and CRs revealed effects broadly similar to those for the easy condition. As summarized in Table 5, activity was greater for hard hits than for CRs in a predominantly left-sided network including regions in inferolateral, dorsolateral, and anterior lateral PFC and in lateral and medial parietal cortices. The regions in which these age-invariant hard condition old/new effects overlapped with those for the easy condition are summarized in Table 7 and Figure 4D.
Hard condition: age-invariant old/new effects
| Location in young (x, y, z) | Peak Z in young | Location in older (x, y, z) | Peak Z in older | N in cluster | Region | Brodmann area |
| Hard hits > CRs | ||||||
| −36, −51, 48 | 5.55 | −30, −66, 42 | 5.68 | 792 | Left inferior/superior parietal lobule | BA 40/7 |
| This cluster also includes subpeaks | ||||||
| −18, −63, 30 | 4.89 | −36, −54, 51 | 5.04 | Left superior parietal lobule | BA 7 | |
| −30, −75, 39 | 4.68 | −12, −72, 54 | 4.84 | Left superior parietal lobule/inferior occipital gyrus | BA 7/19 | |
| −3, −72, 48 | 4.36 | −6, −72, 33 | 4.68 | Left medial parietal/precuneus | BA 7/31 | |
| −45, 24, 30 | 5.12 | −45, 27, 18 | 5.33 | 946 | Left middle frontal gyrus | BA 9/45 |
| This cluster also includes subpeaks | ||||||
| −48, 15, 27 | 5.05 | −42, 6, 27 | 4.85 | Left inferior frontal/precentral gyrus | BA 6/4 | |
| −48, 48, 3 | 4.77 | −48, 33, 3 | 4.66 | Left anterior inferior frontal gyrus | BA 47/10 | |
| −6, 24, 5 | 4.44 | −3, 24, 45 | 4.03 | 158 | Left medial superior frontal gyrus | |
| This cluster also includes subpeaks | ||||||
| 9, 18, 48 | 3.53 | 6, 21, 48 | 4.10 | Right medial superior frontal gyrus | BA 6 | |
| 12, −63, 24 | 4.14 | 12, −66, 30 | 4.37 | 38 | Right medial parietal/precuneus | BA 7/31 |
| 39, −57, 42 | 3.64 | 39, −54, 42 | 3.32 | 5 | Right inferior/superior parietal lobule | BA 40/7 |
| 30, 3, 60 | 3.37 | 30, 3, 60 | 3.57 | 5 | Right medial frontal gyrus | BA 6 |
| CRs > hard hits | ||||||
| 60, −42, 39 | 4.22 | 63, −42, 36 | 5.07 | 30 | Right inferior parietal lobule | BA 40 |
| −3, 36, 0 | 4.07 | 9, 30, −3 | 4.64 | 104 | Anterior cingulate gyrus | BA 32/24 |
| 6, 51, 21 | 4.01 | 0, 51, 21 | 3.81 | 28 | Medial anterior frontal cortex | BA 10/9 |
| 60, −54, 15 | 3.95 | 60, −63, 12 | 3.78 | 7 | Right inferior parietal lobule/superior temporal gyrus | BA 39/22 |
Note: Regions tabulated show significant (P < 0.001, cluster size > 5) signal increases for hard condition source hits versus CRs on the early covariate, common to both age groups, and exclusively masked with the age-related interactions. Separate peaks in the 2 groups reflect the inclusive masking procedure described in the text. See Table 3 for notes on other abbreviations.
Differential activity for source hits versus CRs within and across age groups and across difficulty conditions. Statistical maps represent contrasts of easy condition source hits versus CRs inclusively masked with contrasts of hard source hits versus CRs. See Materials and Methods for details of contrast masking procedures and Figure 2 for colors and display details. (A) Old/new effects common to easy and hard conditions in the young group alone. (B) Old/new effects common to easy and hard conditions in the older group alone. (C) Age-related differences in old/new effects across easy and hard conditions. (D) Age-invariant old/new effects common to easy and hard conditions.
The regions identified by the reverse contrast, for CRs > hard source hits (see Table 5), differed from those identified by the equivalent easy condition contrast. There were CR > hits effects for the hard condition in right lateral parietal cortex and in anterior cingulate and medial anterior frontal cortex. Inclusive masking of the contrasts from the 2 difficulty conditions confirmed that there was no overlap in the age-invariant effects for CR > hits (see Fig. 4D).
Age Differences in Old/New Effects in the Hard Condition
The interaction contrasts of group with old/new effects in the hard condition, like those for the easy condition, revealed differential activity in a number of regions. These are listed in Table 6 and included medial anterior PFC and more lateral anterior and right inferolateral prefrontal regions. Group differences were also reliable in bilateral posterior lateral parieto-occipital cortex and in right temporal and cingulate cortices. There were no group differences within the MTL. As in the easy condition, all these interactions showed a larger old/new effect in the older group than in the younger group (at the chosen threshold). Inclusive masking of this group interaction contrast with that for the easy condition was employed to confirm the extent of this overlap (see Table 8 and Fig. 4C).
Hard condition: age-related differences in old/new effects
| Location (x, y, z) | Peak Z (N) | Region | Brodmann area |
| Old > young for hard hits > CRs | |||
| −33, −63, 21 | 4.13 (54) | Left inferior parietal lobule/superior occipital gyrus | BA 7/19 |
| −15, −12, 36 | 3.95 (24) | Left cingulate | |
| −42, −78, 39 | 3.77 (28) | Left inferior parietal lobule/superior occipital gyrus | BA 40/19 |
| 24, 33, 0 | 3.61 (52) | Right inferior frontal gyrus | BA 47/11 |
| −6, 63, 12 | 3.55 (28) | Medial anterior frontal cortex | BA 10 |
| 3, 54, −6 | 3.53 (40) | Medial anterior frontal cortex | BA 10 |
| 54, −48, −12 | 3.42 (12) | Right middle temporal gyrus | BA 37 |
| 51, 36, 6 | 3.41 (26) | Right inferior frontal gyrus | BA 47/11 |
| 60, −33, 39 | 3.39 (5) | Right inferior parietal lobule | BA 40 |
Note: Regions tabulated show significant (P < 0.001, cluster size > 5) group differences in differential activity on the early covariate for hard condition source hits versus CRs. See Table 3 for notes on other abbreviations.
Influence of Task Difficulty on Age Differences in Neural Correlates of Source Retrieval
Further analyses explored the effects of the difficulty manipulation on the neural correlates of succesful retrieval. For the reasons already noted (see Analysis Strategy), these analyses are not reported in detail. A few regions demonstrated reliably greater differences between source hits in the easy versus the hard condition in the older than in the younger group. These regions included the left superior frontal gyrus (7 voxels, Brodmann area [BA] 8, x = −15, y = 30, z = 51), the anterior cingulate (10 voxels, BA 24/32, x = 0, y = 36, z = 0), the left superior parietal lobule (6 voxels, BA 40, x = −57, y = −51, z = 48; and 12 voxels, BA 40, x = −60, y = −24, z = 30), and the right middle temporal gyrus (8 voxels, BA 21, x = 48, y = −30, z = −3). No regions showed the reverse effect. At this threshold, there was no overlap between these regions and those showing group differences in old/new effects from the easy condition alone. Inclusive masking methods similar to those employed for the old/new effects also revealed no significant difficulty-related regional activity common to the 2 age groups.
Age Differences in Lateralization of Source Retrieval Effects
To address the issue of whether there were age-related differences in the lateralization of retrieval-related activity, a voxel of interest analysis was carried out. Ideally, the locations of these voxels should be derived from comparable but independent data. However, in the absence of an earlier study sufficiently similar in its design and procedure to the present one, this was not possible. Instead, 4 voxels in theoretically important regions were selected on the basis of an analysis that contrasted source hits with CRs across all participants without regard to age and hence was unbiased with respect to age group. Three of these voxels were in left PFC, specifically, middle frontal gyrus (BA 9, x = −45, y = 24, z = 30), inferior frontal gyrus (BA 47, x = −51, y = 24, z = −9), and anterior PFC (BA 10, x = −45, y = 48, z = 0). The fourth voxel was in left lateral parietal cortex (BA 40, x = −36, y = −51, z = 48).
Parameter estimates were extracted from these voxels and the homotopic voxels in the opposite hemisphere. These data were then analyzed by ANOVA with factors of group, old/new (easy source hits vs. CRs), region, and hemisphere. As would be expected, old/new effects were more marked on the left than the right (F(1.0,87.9) = 102.0 [where relevant, P values were assessed on Greenhouse–Geisser corrected degrees of freedom to take account of nonsphericity], P < 0.001). The analysis revealed no evidence of age-related differences in the lateral distribution of retrieval success effects (for interaction of group with old/new and hemisphere, F < 1).
Discussion
Behavioral Performance
Performance in the hard condition, in which participants in both groups saw each studied item once, showed the characteristic pattern of age-related decline in both item and source memory (Spencer and Raz 1995). In the easy condition, however, source accuracy did not differ between groups, although item memory remained somewhat better in the young group. Thus, the primary aim of the difficulty manipulation, which was to allow fMRI contrasts in the context of equivalent source accuracy in young and older groups, was fulfilled. The absence of significant age effects on the RTs associated with source hits from the easy condition and with CRs means that the fMRI findings are relatively free from the confounding effects of differential response times. However, 2 caveats remain when interpreting the fMRI findings. First, whereas source recollection was equated between the groups, this does not guarantee that there were not residual differences in familiarity-based recognition memory (indeed, the slight advantage for the younger participants in item memory in the easy condition suggests that this may have been the case; for futher discussion, see Rugg and Morcom 2005). Second, RTs for CRs were numerically greater in the older than in the younger group (see Fig. 1). We consider the possible impact of group-wise differences in familiarity and processing speed below in our discussion of the fMRI data.
fMRI Data
In the present study, we were able to compare the neural correlates of successful episodic retrieval in older and younger adults when retrieval difficulty was closely, even if not perfectly, matched across the groups. Successful retrieval, as operationalized by the contrast between items assigned to their correct encoding context versus CRs, was associated in both age groups with activity in a left lateralized network that included anterolateral prefrontal and lateral and medial parietal cortices. The level of activity in this network did not differ reliably between the 2 groups. However, a substantial number of regions did demonstrate age-related differences in retrieval activity. Strikingly, the majority of these differences took the form of a crossover interaction such that successful retrieval was associated with enhanced activity (relative to CRs) in older participants, but with reduced activity in the young group. In some regions, however, the age by retrieval success interaction reflected a relative decrease in activity in the younger group and negligible differential activity in the older participants. In many cases, the regions exhibiting greater old/new effects in the older participants abutted those where effects were age invariant.
Age-Related Changes in “Neural Efficiency”
The regions where equivalent retrieval-related activity was found across the 2 groups include several that have been consistently identified in prior studies of episodic retrieval in the young, most notably, anterior and lateral PFC and lateral and medial parietal cortices (see Introduction and Rugg et al. 2002; Wagner et al. 2005). The proximity of many of the regions showing age-related interactions to those manifesting these common effects raises the possibility that when older and younger adults perform at equivalent levels, older participants show an exaggeration of the neural responses seen in the young, that is, they engage the same functionally specialized regions of cortex, but to a greater extent. The overall pattern of age-related commonalities and differences was similar in the hard condition, in which the encoding task was the same for both groups, but the level of recollection differed significantly according to age. However, fewer regions showed group differences than in the easy condition. Possible accounts of regionally specific effects will be discussed below, but first, we consider this striking overall pattern.
The finding of increased cortical recruitment in older adults is consistent with the results of several previous PET and blocked fMRI retrieval studies (Schacter et al. 1996; Backman et al. 1997; Cabeza et al. 1997; Madden, Turkington, et al. 1999). The concomitant age-related reductions of activity reported in some previous studies (Grady et al. 1995; Cabeza et al. 1997) were, however, not seen here. As noted in Introduction, the diluting effects of relatively poor performance in older participants may have led to an overestimation of the incidence of decreased recruitment in older participants in prior studies, including the event-related study of Daselaar et al. (2006; see Introduction). The observation in the present study that overrecruitment was somewhat less marked in contrasts in the hard condition (when performance was not matched) is consistent with this proposal: notably, activity associated with source hits may have been diluted by a higher proportion of “source guesses” than was the case in the young. (It might appear surprising in this context that age-related differences in activity for easy vs. hard source hits would not be detected in regions manifesting easy old/new effects; however, this lack of overlap of effects is a null finding).
Greater cortical recruitment with increasing age has been noted during a variety of tasks, as described in Introduction, but the present study is the first to attempt to examine the hemodynamic correlates of episodic retrieval when recollective processes were matched between age groups (for a companion ERP study that adopted the same matching procedures, see Li et al. 2004). Although the matching was not perfect, the clear-cut pattern of increased recruitment in older participants, with no regions showing underrecruitment, remains especially notable in this context. Also notable is that there was no evidence in the present older group of a reduction in the lateralization of recollection effects relative to the young. The findings suggest that the reduction in hemispheric asymmetry sometimes observed in older adults is not an invariable finding but may instead be an example of a more general tendency toward increased recruitment.
Age-related overrecruitment may be a consequence of a reduction in something akin to neural efficiency (Rypma and D'Esposito 2000; Cabeza 2002; Logan et al. 2002; Buckner 2004; Reuter-Lorenz and Lustig 2005). This might reflect cortical dedifferentiation, that is, the beginning of a breakdown in functional specialization (e.g., Grady et al. 1995; Grady 2002; Schiavetto et al. 2002; Park et al. 2004). This, in turn, could reflect several underlying mechanisms, for example, an age-related decline in neural signal-to-noise (Rypma and D'Esposito 2000). Alternatively, cortical “overrecruitment” may be a compensatory, adaptive response (e.g., Cabeza et al. 1997, 2002; Cabeza 2002; Grady et al. 2002; Park et al. 2004). Such adaptive changes imply the existence of primary age-related changes in neural function—such as dedifferentiation—in the face of which “compensatory” changes become advantageous. A final possibility stems from the proposal that aging impairs processes responsible for the efficient allocation of cognitive resources and hence disrupts the optimal engagement of regions supporting task performance (Logan et al. 2002). Like the neural dedifferentiation account, but in contrast to the compensation hypothesis, the proposal of Logan et al. (2002) implies that age-related overrecruitment is a cause rather than a consequence of processing inefficiency. Current data do not permit these very different scenarios to be distinguished.
The age-related decline in processing speed that is seen across many different cognitive domains has also been linked to possible age-related changes in neural efficiency (Backman et al. 2000; Li et al. 2000; Salthouse 2000). It is conceivable that the minimal age-related differences in RTs in the present study contributed directly to the age-related differences observed in brain activity. However, it is perhaps more likely that any residual RT differences share common underlying causes with the widespread age-related increases in retrieval-related neural activity.
At first glance, the attenuation of group differences in the hard relative to the easy condition comparison might appear relevant to the question of whether the findings from the easy condition should be interpreted as evidence for an age-related decline in neural efficiency. The effects of a decline in efficiency might be expected to have been more pronounced in the hard than in the easy condition because of its greater processing demands. However, for several reasons, this prediction does not necessarily follow. The easy condition may have been sufficiently demanding to tap the majority of older participants' cognitive reserve, leaving them unable to meet the demands of the harder condition by allocation of additional neural resources (cf. Mattay et al. 2006). Furthermore, increasing the demands of a retrieval task may not simply enhance the neural correlates of retrieval success; instead, there might be a diversion of resources to preretrieval processing and away from the processing of successfully retrieved information. Finally, retrieval effort may itself have different neural correlates according to age. Discriminating between these possibilities (as well as accounting for the differential effects of guessing between the 2 groups in the hard condition when performance was not matched) is not possible on the basis of the present findings. Thus, the most telling between-group comparison is with respect to the easy condition, where the different components of retrieval processing are matched reasonably closely in the 2 groups.
Not all the age-related interactions were due to group differences in the extent to which regional activity increased in older participants as a function of successful retrieval. In the young participants, several regions, including anterior medial prefrontal, right anterior temporal, and right extrastriate cortices, demonstrated activity decreases in the easy condition. An equivalent CR > hits effect in the older group was observed only in one extrastriate region. One possible general account of this age-related attenuation of CR > hits effects is that the latter reflect the active suppression of processing that would otherwise interfere with or divert resources from successful retrieval. If aging impairs inhibition, as has been proposed (Hasher and Zacks 1988), activity reflecting active suppression might be expected to be attenuated in older adults. Further data are needed to test this possibility. It is also unclear whether a greater prominence of hits > CR effects and a reduction in CR > hits effects in older adults, as seen in the present study, could have a unitary explanation (e.g., in terms of neural inefficiency). Resolving this issue will depend on a better understanding of the role of activity decreases in young adults, although some specific accounts of group differences in CR > hits effects are considered in the section Priming and related pheonomena.
Age-Related Differences in Retrieval Processing
The foregoing discussion has focused mainly on the generic aspects of the results. However, it may also be possible to account for some of the group differences in terms of differences in the cognitive strategies and operations employed by the young and older participants during the retrieval task. Interactions in MTL and prefrontal and parietal cortices are considered in terms of possible group-wise differences in specific memory-related processes that might have been present despite the matching of the overall level of recollection in the easy condition.
Priming and related phenomena.
Activity decreases associated with the presentation of previously studied items have been linked to implicit memory phenomena such as priming (Schacter and Buckner 1998; Henson et al. 2002). Despite the explicit memory demands of the present task, the possibility that at least some of the CR > hits effects reflect priming cannot be ruled out. The distribution of regions showing CR > hits effects also showed some sensitivity to the difficulty manipulation, which involved different numbers of item repetitions at encoding in the 2 age groups. One possibility therefore is that group differences arose from differential repetition suppression linked to priming, particularly perhaps in those extrastriate regions sensitive to the difficulty manipulation, and known to show repetition suppression in visual tasks (see Schacter and Buckner 1998). However, this possibility does not account for the direction of these differences as the older group received an extra encoding repetition but showed less widespread CR > hit effects than did the young group. The form of the interactions might be explained by an impairment of repetition suppression in older relative to young participants that was greater in magnitude than any effect of the additional study presentation. There is some recent evidence of age-related differences in repetition suppression effects (Daselaar et al. 2005; Chee et al. 2006), but the picture is not clear-cut (Lustig and Buckner 2004), and it must be remembered that in many tasks, implicit and explicit memory effects are likely to coexist (see Mitchell and Bruss 2003).
Familiarity versus recollection.
Studies in young adults have identified CR > hits effects within the MTL as a potential neural correlate of item familiarity, possibly in association with enhanced encoding of novel items (Henson et al. 2003; Stark and Okado 2003; Weis et al. 2004; for review, see Henson 2005). The age-related interaction in left anterior MTL, with prominent CR > hits effects in the young participants, may thus reflect weaker item familiarity in the older group, as already hinted at by the behavioral findings (see also Duarte et al. 2006). The interaction is also consistent with the possibility that an age-related reduction in processing resources (Craik 1983; Logan et al. 2002) meant that older participants were less likely to divert resources away from retrieval processing in support of new-item encoding. The first of these accounts is more consistent with the absence of an age × old/new interaction in the MTL in the contrasts based on the hard condition (although this of course is a null finding). Another possibility is that CR > hit effects represent additional processing afforded novel items.
Prominent CR > hits effects specific to the young group were also evident in medial anterior PFC. Relative decreases in activity have been reported in this region for more versus less familiar items (Yonelinas et al. 2005), suggesting that the interaction in the present study might reflect a greater level of familiarity associated with source hits in the young group. However, the picture is not clear-cut: the young group of Daselaar et al. (2006) showed greater recollection-related increases in this region than their older group, contrary to the present findings. In studies in young adults, both decreases (Kahn et al. 2004) and increases (Henson et al. 2000; Maratos et al. 2001) in activity have been reported for recollected relative to new items in broadly the same region, as well as increases for recollected versus familiar items (Cansino et al. 2002; Yonelinas et al. 2005). Rather than reflecting memory processing directly, it is seems likely that this region is involved in attentional processing associated with responding to stimulus events (Burgess et al. 2005) and in integrating responses to these events with emotional and reward information (Bechara et al. 1999; O'Doherty et al. 2003; Nagai et al. 2004). The relation of such processing to memory retrieval and its relevance to aging are currently unknown.
Within lateral PFC, age × old/new interactions were anterior to the effects common to both age groups (see Tables 1 and 2 and Figs 1C and D; also Tables 7 and 8 and Figs 3C and D), a finding difficult to relate to earlier findings of age-related activity increases in lateral rather than anterior PFC (see Introduction and Cabeza et al. 1997; Backman et al. 1997; Madden, Gottlob, and Allen 1999; Daselaar et al. 2003). Although numerous design and performance differences between studies have already been noted that could account for this difference, it is has yet to be established that anterior and posterior lateral PFC have dissociable functions in successful episodic retrieval (for review see Fletcher and Henson 2001; Rugg 2004). The study of Daselaar et al. (2006) did not detect any lateral prefrontal age-related effects, but the relatively lower level of recollection in their older group and their exclusive focus on recollection-related increases could have obscured potential differential activity.
Age-invariant old/new effects common to both difficulty conditions
| Location (x, y, z) | Peak Z (N) | Region | Brodmann area |
| Hits > CRs | |||
| −27, −66, 45 | 5.52 (583) | Left inferior/superior parietal lobule | BA 40/7 |
| This cluster also includes subpeaks | |||
| −21, −63, 33 | 5.27 | Left superior parietal lobule | BA 7 |
| −6, −72, 30 | 5.25 | Medial parietal/precuneus | BA 7/31 |
| −24, 6, 54 | 4.90 (62) | Left superior frontal gyrus | BA 6 |
| −51, 27, 30 | 4.80 (559) | Left middle frontal gyrus | BA 9/45 |
| This cluster also includes subpeaks | |||
| −39, 3, 42 | 4.46 | Left middle frontal gyrus | BA 8/6 |
| −45, 6, 27 | 3.92 | Left inferior frontal/precentral gyrus | BA 6/4 |
| −42, 48, −3 | 3.72 | Left anterior middle frontal gyrus | BA 10 |
| −6, 15, 54 | 4.37 (37) | Left medial superior frontal gyrus | BA 6 |
| 18, −63, 27 | 4.23 (23) | Right superior parietal lobule | BA 7 |
Note: Regions tabulated show significant (P < 0.001, cluster size > 5) signal increases for easy and hard condition source hits versus CRs on the early covariate, common to both age groups, and exclusively masked with the age-related interactions. Note that peaks shown are (arbitrarily) those for the young group for easy source hits versus CRs. See text for description of the masking procedure and Table 3 for notes on other abbreviations.
Age-related differences in old/new effects common to both difficulty conditions
| Location (x, y, z) | Peak Z (N) | Region | Brodmann area |
| Old > young for hits > CRs | |||
| −36, −60, 24 | 4.50 (34) | Left inferior parietal lobule/superior occipital gyrus | BA 40/19 |
| −48, −75, 36 | 4.27 (26) | Left inferior parietal lobule/superior occipital gyrus | BA 40/19 |
| 0, 48, −6 | 3.87 (27) | Medial anterior frontal cortex | BA 10 |
| −12, 60, 15 | 3.76 (15) | Medial anterior frontal cortex | BA 10 |
| 18, 39, −3 | 3.70 (5) | Right middle frontal gyrus | BA 10/11 |
| −12, −12, 36 | 3.50 (9) | Left cingulate | BA 24 |
| 21, 45, 18 | 3.47 (8) | Right anterior middle frontal gyrus | BA 10/9 |
| 60, −33, 42 | 3.45 (5) | Right inferior parietal lobule/postcentral gyrus | BA 40/2 |
Note: Regions tabulated show significant (P < 0.001, cluster condition >5) source hits versus CRs, common to the easy and the hard condition. Note that peaks shown are those for the easy condition group differences. See text for description of the masking procedure.
In lateral parietal cortex, on the other hand, functional subdivisions with regard to retrieval have recently been proposed. In the light of these proposals, the more anterior and superior loci of the common effects relative to the age-related interactions (Figs 1 and 2C) suggests that aging affects processing specific to recollection, rather than associated “executive” or control processes (Henson, Rugg, et al. 1999; Herron et al. 2004; Shannon and Buckner 2004; Wheeler and Buckner 2004; Henson et al. 2005; Wagner et al. 2005; Yonelinas et al. 2005). Given the commonly held view that aging is associated with executive impairment, there is if anything an a priori reason to expect the opposite pattern (Morris et al. 1990). Consistent with an indirect role for superior lateral parietal cortex in retrieval, Daselaar et al. (2006) also report age-related differences in such a region: activity increases appeared to track item familiarity in older adults and recollection in the young.
Two recent studies also show familiarity sensitivity in lateral parietal regions (Yonelinas et al. 2005; Daselaar et al. 2006). In the former study, the location of these regions was similar to those showing age-invariant hits > CR effects in the present study (with possible minimal overlap with the age × old/new interaction regions). Daselaar et al. (2006), on the other hand, showed (age invariant) familiarity-related effects in a similar parietal region to that manifesting age-related differences in the present study. However, the direction of the present lateral parietal age × old/new interactions indicates that they are unlikely to be due to a group-wise difference in familiarity. Yonelinas et al. (2005) and Daselaar et al. (2006) report activity increases in this region in association with increases in familiarity. Thus, in the present study, the young group, with the higher item memory (and hence higher familiarity), would be expected to show the higher level of regional activity. This is the opposite of what we demonstrate.
Variations in the level of familiarity have also recently been reported to modulate activity in anterolateral PFC; however, the direction of this modulation would again predict greater recruitment of these regions in the group with the higher level of familiarity, that is, the young (Yonelinas et al. 2005; Montaldi et al. 2006). It seems unlikely therefore that the group × old/new interactions we report outside the MTL are secondary to this residual performance confound. Not only does this not explain the key regional group differences but it is also inconsistent with the general tendency toward attenuation of age-related differences in the hard condition, in which differences between the groups in both familiarity and recollection associated with source hits are more marked.
Amount and nature of recollected material.
Another possibility is that the different number of study repetitions employed in the easy condition to equate performance potentiated age-related differences relative to the hard condition. Age-related differences in hit > CR effects could in principle reflect a repetition-dependent enhancement in the older group of specific aspects of retrieval processing despite the equivalence of recollection levels in the 2 age groups. One such aspect that might have been enhanced is processing associated with the retrieval of visually specific content, a possibility bolstered by the finding that there were group × old/new interactions in extrastriate regions and in precuneus in the easy but not the hard condition (for evidence linking these regions with the retrieval of visual information, see e.g., Wheeler and Buckner 2003; Woodruff et al. 2005). These interactions may therefore reflect additional processing of recollected visual information in the older group as a result of the extra repetition (Poorer visual acuity in the older group—despite the use of scanner-compatible glasses—could have contributed to extrastriate regional effects by placing additional demands on their cortically mediated visual processing. However, given the greater prominence of these effects in the easy condition, where items had been encountered multiple times, this seems unlikely.). However, this would not explain the difficulty-invariant age-related interactions evident in other regions.
A related possibility is that despite the equivalent levels of source accuracy in the 2 groups in the easy condition, the extra study repetition in the older group generated higher levels of recollection of information that was nondiagnostic of source (“noncriterial recollection”; see Toth and Parks 2006) but which was nonetheless reflected in fMRI old/new effects. This could potentially explain easy condition group differences in hits > CR effects in several regions as the magnitude of old/new effects is likely to be positively correlated with the amount of recollected information (e.g., Vilberg et al. 2006; Vilberg KL and Rugg MD, in preparation). By the same token, however, this is an unlikely account of the difficulty-invariant age-related interactions, as in the hard condition the magnitude of hits > CR effects remained greater in the older group, but noncriterial recollection, like source recollection, was likely to be lower (Toth and Parks 2006). Furthermore, neither of the foregoing can account for the crossover form of many of the interactions. To do so, these factors would have had to give rise in several regions both to increased activity for source hits relative to CR and, concurrently, to an attenuation of activity decreases for source hits relative to CR.
Finally, Li et al. (2004) conducted a companion ERP study to the present experiment that employed the same tasks and behavioral procedures. On the basis of qualitative differences in the ERPs elicited in association with successful source retrieval, it was proposed that the 2 groups may have employed different informational bases for their correct source judgments, the older group basing their decisions largely on the recovery of visual information about the studied items and the young retrieving mainly conceptual information (e.g., information about the decision made on each item at study). Insofar, as this account is valid in respect of the findings of Li et al. (2004), a contribution to the present findings of between-group differences in the information employed in service of source judgments cannot be ruled out. That said, age × retrieval success interactions were not confined to regions specifically associated with visuospatial processing. Furthermore, as already noted, although age × old/new interactions were found in extrastriate cortex in the easy condition, these were not apparent in the hard condition. By contrast, in the ERP study of Li et al. (2004), age × old/new interactions were evident regardless of difficulty. Thus, the current fMRI effects are unlikely solely to reflect group differences in the activity of the neural populations responsible for the ERP effects.
Conclusions
In summary, the present study demonstrates that when the level of source memory is matched between young and older adults, the identity of many of the brain regions engaged during successful source retrieval does not vary with age. However, older adults recruit these regions more extensively than do the young and show fewer retrieval-related activity reductions. This overall pattern is most suggestive of age-related differences in the efficiency with which neural activity can support cognitive performance. This is of course a tentative conclusion given the imperfections in the matching of retrieval processing achieved in the present study. It is, however, the most parsimonious account of the results as a whole and is in keeping with other findings in the literature. An important aim of future studies will be to determine the extent to which age-related increased recruitment is still evident as the matching of processing is further refined.
The authors and this research were supported by the Wellcome Trust and the Medical Research Council. A.M.M. was also supported by a fellowship from Research into Ageing, UK. We gratefully acknowledge the assistance of the radiography staff of the Functional Imaging Laboratory. Conflict of Interest: None declared.