


Abstract
Viewing a speaker's articulatory movements substantially improves a listener's ability to understand spoken words, especially under noisy environmental conditions. It has been claimed that this gain is most pronounced when auditory input is weakest, an effect that has been related to a well-known principle of multisensory integration—“inverse effectiveness.” In keeping with the predictions of this principle, the present study showed substantial gain in multisensory speech enhancement at even the lowest signal-to-noise ratios (SNRs) used (−24 dB), but it was also evident that there was a “special zone” at a more intermediate SNR of −12 dB where multisensory integration was additionally enhanced beyond the predictions of this principle. As such, we show that inverse effectiveness does not strictly apply to the multisensory enhancements seen during audiovisual speech perception. Rather, the gain from viewing visual articulations is maximal at intermediate SNRs, well above the lowest auditory SNR where the recognition of whole words is significantly different from zero. We contend that the multisensory speech system is maximally tuned for SNRs between extremes, where the system relies on either the visual (speech-reading) or the auditory modality alone, forming a window of maximal integration at intermediate SNR levels. At these intermediate levels, the extent of multisensory enhancement of speech recognition is considerable, amounting to more than a 3-fold performance improvement relative to an auditory-alone condition.
Introduction
Speech, surely one of the most complex inputs that the human brain must decode, is fundamentally perceived as an auditory experience. Yet, research has shown that there are often profound influences from the visual system on this ostensibly auditory perception and that in some cases, visual inputs can even override the veridical inputs of the auditory system (e.g., McGurk and MacDonald 1976; Spence and Driver 2000). Functional imaging studies have bolstered this view by identifying regions of the brain that show integrative processing for the combination of visible and heard speech (e.g., Calvert and others 2000; Calvert and Campbell 2003). Our ability to decode speech is even more remarkable when one considers the relative ease with which humans can understand a speaker under what are often highly adverse listening conditions (e.g., the factory floor, the noisy Manhattan sidewalk, the holiday office party). To accomplish this, it is clear that viewing a speaker's articulatory movements, actually watching the actions of the mouth, provides critically important complementary information and serves to augment and enhance our auditory capabilities (see e.g., Sumby and Pollack 1954; Grant and Seitz 2000). Indeed, it has been shown that viewing the ancillary head movements that typically accompany speech also provides linguistic information (e.g., Munhall and others 2004).
In seminal work, Meredith and Stein (1986) delineated a set of principles of multisensory integration, one of which they termed inverse effectiveness (see also Stein and Meredith 1993). That is, during recordings in multisensory neurons of the cat superior colliculus (SC), they repeatedly found that maximal multisensory response enhancements occurred under circumstances where the constituent unisensory stimuli were minimally effective in evoking responses. In other words, multisensory enhancement was greatest when unisensory stimuli were at their weakest, clearly a very useful property in a structure specialized for orientation. That is, potential ambiguity from weak sensory input (e.g., the direction of an object or event) can be compensated for by inputs from a second or third sensory system, providing a significant advantage for the organism. Behavioral work confirmed these properties (Stein and others 1988).
At higher intensities, when the unisensory stimuli evoke more robust responses of their own, redundant information is provided by both unisensory inputs, and the need for multisensory integration is considerably lessened, and this is paralleled by a drop in the amplitude of multisensory enhancements seen in responses of SC neurons. Analogous to this principle of inverse effectiveness, classical multisensory speech studies, undertaken with both hearing impaired and normal hearing listeners, claimed that the gain from seeing a speaker's articulations was inversely related to the signal-to-noise ratio (SNR) (e.g., O'Neill 1954; Sumby and Pollack 1954; Neely 1956; Erber 1969, 1971, 1975; Binnie and others 1974; McCormick 1979), and more recent neurophysiological investigations have made similar claims (e.g., Callan and others 2001, 2003; see also Calvert and Lewis 2004).
A close reading of the early behavioral studies (Sumby and Pollack 1954; Erber 1969, 1975) reveals a potential flaw in this assertion. That is, these early studies used a delimited set of word stimuli that were presented to the subjects prior to and during the experiments in the form of checklists. It is very likely that this manipulation greatly facilitated word recognition overall, leading to artificially high improvements in speech recognition due to speech-reading. Further, this manipulation would have had particularly large effects at low SNRs. That is, it is easier to guess a word based on very sparse input when the options are limited to relatively short lists. In the more recent neurophysiological investigations, we also come upon the claim that multisensory speech-processing regions in the human superior temporal sulcus (STS) or superior temporal gyrus respond according to the principle of inverse effectiveness. In an elegant study, Callan and others (2003) showed that STS activation to audiovisual (AV) speech signals was significantly enhanced when the speech signal was embedded in noise in comparison with a condition without noise. They interpreted this finding as evidence for the operation of inverse effectiveness in STS but unfortunately, only a single noise level was used. In fact, behavioral testing in an auditory-alone condition showed that their subjects were able to recognize more than 20% of the words at this noise level, indicating a relatively high baseline level of intelligibility. If the principle of inverse effectiveness can in fact be applied to speech-processing regions, then the prediction would be that the AV gain should increase with decreasing SNR's, but this was not tested in the Callan study.
We contend that in classical behavioral studies (Sumby and Pollack 1954; Erber 1969, 1975), the large gain from visual input at low SNRs was enhanced because of the methodology used. Here, we used a modified design employing a much larger stimulus set, so that each stimulus presentation was unique, and no checklists were available to subjects. We predicted that, unlike these previous studies, we would find highest gain due to multisensory AV enhancement at intermediate SNRs (note that a somewhat similar prediction has been made by Bernstein and others 2004 based on a review of classical studies [Sumby and Pollack 1954; MacLeod and Summerfield 1987]. They point out that although these studies claim to show enhancements at very low SNRs [−15 to −20 dB], enhancements at these levels are mainly due to high speech-reading scores, driven by the use of delimited wordlists). We reasoned this on the following grounds. While the SC is a structure specialized for detection and orientation, a function that clearly benefits greatly from inverse effectiveness, the speech recognition system is concerned with higher level semantic recognition and not just the simple presence or absence of a speech stimulus. Thus, it is reasonable to expect considerable differences between the modes of processing within the speech recognition system and that found in the SC.
We set out to delineate the conditions under which visual articulatory cues have their greatest impact on speech recognition. We reasoned that there would be a maximal window of multisensory integration, a range within which reliance on either pure auditory or pure visual inputs would produce submaximal recognition. That is, when auditory noise in the environment is of sufficient magnitude to mask speech signals, it is obvious that the speech recognition system would be biased to rely almost entirely on visual inputs (i.e., speech-reading) (see also Erber 1969), and when the auditory signal is intelligible and unambiguous, the system would be biased toward substantial or even complete reliance on the auditory inputs themselves. Given these 2 extrema, it stands to reason that some interim value exists where speech recognition will be weighted toward an equal reliance on both auditory and visual inputs and that this point on the continuum will be the point of highest multisensory integration. We sought to determine this maximal level and to ascertain whether multisensory AV speech mechanisms have a maximal tuning window.
Methods
Subjects
Twenty adults (9 females) between the ages of 18 and 59 (mean = 31, standard deviation [SD] = 11.5) participated in this study as healthy volunteers. All participants were native English speakers with normal or corrected-to-normal vision and had normal hearing and no history of neurological or psychiatric disorders according to self-report. The Institutional Review Boards of the Nathan Kline Institute for Psychiatric Research and of the City College of the City University of New York approved the experimental procedures, and each subject provided written informed consent.
Stimuli
Stimulus materials consisted of 525 simple monosyllabic words (taken from the online Medical Research Council Psycholinguistic database: http://www.psy.uwa.edu.au/mrcdatabase/uwa_mrc.htm). The words were selected from a well-characterized normed set based on their written-word frequency (Kucera and Francis 1967) (it should be pointed out that what constitutes everyday language usage has clearly changed to some extent since the time this normed word set was first established. Here, care was taken to only select words that all authors considered to be still in common use. In addition, the chosen words were distributed over conditions randomly and were checked for equal distributions afterward). The face of a female speaker was digitally recorded articulating the words. These movies were digitally remastered, so that the length of the movie (1.3 s) and the onset of the acoustic signal were highly similar across all words. Average voice onset occurred at 520 ms after movie onset (SD = 30 ms). The words were presented at an intensity of 50 dB sound pressure level (SPL). Sound level for each word was adjusted to 50 dB SPL using a measure of average intensity across the duration of words, measured using a Brüel and Kjær Type 2236 Sound Level Meter with the time constant set at “F.” Seven different levels of pink noise were presented simultaneously with the presentation of the words at 50, 54, 58, 62, 66, 70, and 74 dB SPL. Noise onset was at the same time as the movie onset, 520 ms before the voicing began. The SNRs were therefore 0, −4, −8, −12, −16, −20, and −24 dB SPL. The movies were presented on a 21-inch computer monitor at a distance of 1.7 m from the participant with a rate of 30 frames/s. The whole face of the speaker was visible and extended 6.3° horizontally and 7.6° vertically. The words were presented from a speaker situated in the center on top of the screen, and the noise was presented from speakers flanking both sides of the screen.
Procedure
The main experiment consisted of 2 conditions: in the auditory-alone condition (A), 175 words (25 words per noise level) were presented in conjunction with a still image of the speaker's face; in the AV condition, the speaker's face articulated another set of 175 words. Words were randomly assigned to all of the conditions and noise levels. Stimulus presentation of A and AV trials were also randomly intermixed. A subset of 9 participants from the same pool of subjects received a third speech-reading–alone condition (V), where we used an additional 175 words. In this condition, the speaker's face articulated the words but no auditory word signal was present. Again, this condition occurred with all 7 levels of noise, and V trials were randomly intermixed with all other trials. Please note that the A condition where a visual stimulus (still image) is provided and the V condition where no auditory stimulus is present are not exactly equivalent. The crucial comparison, however, is not made between the A and the V condition but the A and the AV condition.
Participants were instructed to watch the screen and report which word they heard. If a word was not clearly understood, they were asked to guess which word was presented. The experimenter recorded a response that exactly matched the target word presented as a correct answer while any difference to the target was recorded as an incorrect answer. Pacing of the experiment was under participant control; the participant initiated the next trial with a button press. The experiment consisted of 5 blocks with 105 words per block for participants who received all 3 conditions and 70 words per block where only A and AV conditions were present.
After the experiment, participants were presented with the full list of words used in the experiment. Subjects were asked to indicate any words that they had not heard before and words that they had heard before but did not know the meaning of. A list of pseudowords was randomly intermixed with the words in the list as catch trials to control for the possible tendency of subjects to not report words they did not know. This test was run to ensure that no subject with unusually low vocabulary size had been inadvertently included. A cutoff criterion of 90% word identification was preset, but none of the subjects fell below that criterion.
Results
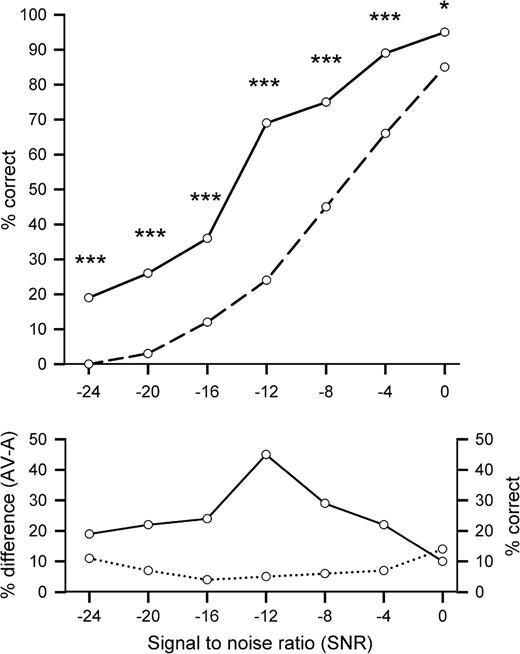
A 2 × 7 repeated measures analysis of variance with the factors of condition (A and AV) and SNR (1–7) were employed to analyze the data. As expected, the level of noise affected recognition performance significantly, F6,114 = 361.27, P < 0.001, η2 = 0.99—the lower the SNR, the fewer words that were recognized (see Fig. 1). In the auditory-alone (A) condition, we can see a monotonic increase ranging from a recognition accuracy of essentially zero at an SNR of −24 dB to 85% at an SNR of 0 dB. An independent t-test revealed that the first SNR level where word recognition was significantly different from zero was at −20 dB, t19 = 3.27, P < 0.01. The SNR where participants began to be able to make effective use of the auditory information must therefore be somewhere between −24 and −20 dB. Whereas participants recognized absolutely no words in the auditory-alone condition at −24 dB, performance jumped to 19% at this noise level in the AV condition. Note that speech-reading alone can only account for 8–9% of this performance boost (see below). At the other extreme (0 dB SNR), performance improved more modestly from 85% (A) to 95% (AV).
The top panel depicts the percentage of correctly identified words (% correct) depending on the SNR for the auditory-alone (A: dashed line) and the AV (solid line) conditions. Significant differences between both conditions are indexed with stars (*P < 0.05; ***P < 0.001). The bottom panel shows the multisensory gain as the difference (AV-A) in speech recognition accuracy as a function of level of SNR (solid line). The dotted line represents performance in pure speech-reading (V) in percent correct.
Overall, speech recognition benefited substantially from the additional visual stimulation, F1,114 = 77.63, P < 0.001, η2 = 0.8, and the interaction between both factors was also highly reliable, F6,114 = 9.93, P < 0.001, η2 = 0.78, indicating that the performance enhancement due to visual stimulation was greater at certain SNR levels than others. This interaction held true even when we excluded the lowest (−24 dB) and the highest (0 dB) SNRs to account for floor and ceiling effects that might potentially have driven the interaction, F4,76 = 8.22, P < 0.001, η2 = 0.3.
As noted above, only a subset of participants received the V-alone condition. In order to ensure that there was no difference between this smaller group and the rest of the population who did not receive this condition, we tested for any differences in performance between the 2 subpopulations on the 2 common conditions (A and AV). No significant effect of performance was found in the A and the AV conditions (F2,17 = 0.53, P = 0.599, η2 = 0.058).
Figure 1 (top panel) displays the difference between conditions AV and A at all 7 noise levels employed. A series of protected comparisons (paired 2-tailed t-tests) revealed differences in recognition accuracy at all SNR levels, and the P values for these tests are indexed in Figure 1 by asterisks. Figure 1 (bottom panel) plots the absolute difference in recognition due to visual input (i.e., AV-A) showing an inverted u-shaped relationship between the gain in recognition accuracy due to the additional visual stimulation and SNR. In order to characterize the gain in the AV condition, we used the absolute difference in percent, in keeping with former studies of speech recognition performance (e.g., Sumby and Pollack 1954; Erber 1969, 1975; Callan and others 2001, 2003). It should be noted though that the method by which gain should be appropriately characterized is a matter of ongoing debate, an issue we will return to in the Discussion section below.
Using the measure of absolute gain, the largest benefit is found at the center of the curve at an SNR of −12 dB with a clearly discontinuous gain of some 45% in recognition accuracy at this level. Interestingly, a post hoc analysis revealed that age correlated significantly with speech recognition performance during the AV condition (r = −0.21; P < 0.05) but not with A (r = −0.1; P > 0.05). That is, in our sample, there appears to be a gradual change with age in the AV performance that is not due to hearing loss, which would be reflected in lower auditory-alone scores. Work is presently underway to both confirm and explicate this age effect (an upper age range cutoff of 60 years was used in the present study. The performance of all subjects in the A condition fell in the range of normal variation of this sample. Hence, there was no reason to exclude older subjects from the sample).
Recognition accuracy in the V condition (; SD = 7%) stayed consistent over all noise levels. We also reasoned that if the gain from additional visual input was mainly dependent on speech-reading, then one would expect to find strong correlations between speech-reading performance and performance in the AV condition across all SNR levels. A Pearson product–moment correlation suggested a significant relationship between speech-reading (V) and averaged auditory visual gain (AV-A) at the 2 lowest SNRs of −24 and −20 (n = 9; r = 0.75, P < 0.05; r = 0.74, P < 0.05). In contrast, no relationship was found at intermediate SNRs of −16, −12, −8, and −4 dB (r = −0.14, P = 0.71; r = −0.21, P = 0.58; r = 0.36, P = 0.34; r = 0.41, P = 0.27). Surprisingly, a significant correlation was found at the 0 dB SNR (r = 0.72; P < 0.05) which is likely due to a relationship between speech-reading ability and overall performance.
Note that results from the test of word recognition showed that the amount of words that subjects were unfamiliar with was negligible (<2%). All subjects identified the pseudowords correctly.
Discussion
Here, we explored the gain provided by visual articulatory information on the recognition of speech embedded in noise. In particular, we wished to establish the levels at which multisensory AV interactions resulted in the greatest benefits. In the past, it has been suggested that the gain provided by AV stimulation continues to increase as the information available from the auditory modality decreases (Sumby and Pollack 1954; Erber 1969). Our thesis was that this finding was at least partly due to the fact that in these previous studies, subjects were exposed to the word material both before and during the experiment (by way of checklists) resulting in artificially high speech-reading scores at low SNRs. Here, we used a much larger pool of word stimuli, participants had no previous exposure to the material, words were used only once, and no checklists were employed. This resulted in substantially different results than those previously reported. We found that word recognition through speech-reading was considerably poorer at low SNRs than previously shown (Sumby and Pollack 1954; Erber 1969). Rather, the absolute gain from AV stimulation, measured here using the original method of Sumby and Pollack (AV-A), was found to be maximal at an SNR level of approximately −12 dB or where recognition accuracy in the auditory-alone condition was approximately 20% (center of the curve in Fig. 2). In line with our prediction, this window of maximal integration is located between the extremes where observers have to rely mostly on speech-reading (−24 dB) and where information from visual articulation is largely redundant to the auditory signal (0 dB).
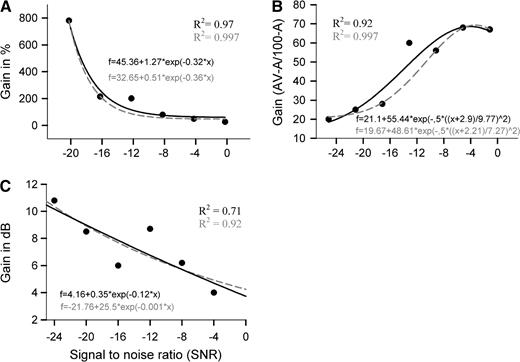
Graphs show fitted curves (black traces) for 3 additional methods of defining the AV gain function. Graph A shows gain in percent ((AV-A) × 100/AV). Graph B displays gain corrected for the ceiling effect (AV-A/100-A) and graph C shows gain in dB. The gray-colored dashed traces represent the curve fits when the value at −12 dB is excluded from the calculation. “Note that in graph A, the −24 dB data point is excluded because performance in the auditory-alone condition was at zero.”
Alternate Ways of Characterizing the Data
In the literature, the gain from multisensory in comparison with unisensory stimulation has been characterized in a variety of ways depending on the subject under study and the dependent measure used. Figure 2 shows several often used approaches applied to the present data set, which rather unfortunately appear to lead to somewhat different conclusions concerning the locus of maximal gain. For example, graph A in Figure 2 shows AV benefit as gain in percent, clearly displaying some of the hallmarks of inverse effectiveness, with gain steadily increasing as SNR is lowered. The black trace in graph A represents a best-fit nonlinear regression that characterizes all the data points with an R2 of 0.97. However, the data point at −12 dB is not well explained by this curve fitting. Statistical testing of the residual values of each data point shows that the residual of the −12 dB data point is significantly different from all other points (z = 4.34, P < 0.0001; see Table 1). Refitting the curve excluding the data point at −12 dB (dashed orange trace) improves the fit to a near perfect R2 of 0.997.
Table shows observed, predicted, and residual values for the fitted curves (black traces) of the 3 gain estimates (gain in %, AV-A/100-A, and gain in dB).
| Observed | Predicted | Residual | z-score | P value | |
| Gain in % | |||||
| −20 | 766 | 759.85 | 6.42 | 0.15 | 0.88 |
| −16 | 200 | 246.56 | −46.56 | −1.23 | 0.23 |
| −12 | 187 | 102.04 | 84.96 | 4.34 | 0.0000 |
| −8 | 66 | 61.33 | 4.67 | 0.11 | 0.91 |
| −4 | 35 | 49.86 | −14.86 | −0.35 | 0.72 |
| 0 | 12 | 46.63 | −34.63 | −0.86 | 0.39 |
| AV-A/100-A | |||||
| −24 | 19 | 17.47 | 1.53 | 0.28 | 0.78 |
| −20 | 24 | 24.07 | −0.07 | −0.01 | 0.99 |
| −16 | 27 | 34.65 | −7.65 | −1.66 | 0.1 |
| −12 | 59 | 48.01 | 10.99 | 3.39 | 0.001 |
| −8 | 55 | 60.47 | −5.47 | −1.07 | 0.28 |
| −4 | 67 | 67.19 | −0.19 | −0.03 | 0.97 |
| 0 | 66 | 65.15 | 0.85 | 0.18 | 0.88 |
| Gain in dB | |||||
| −24 | 10.8 | 10.16 | 0.64 | 0.42 | 0.68 |
| −20 | 8.5 | 8.99 | −0.49 | −0.55 | 0.58 |
| −16 | 6 | 7.56 | −1.56 | −1.86 | 0.06 |
| −12 | 8.7 | 6.77 | 1.93 | 2.0 | 0.046 |
| −8 | 6.2 | 5.12 | 1.08 | 0.83 | 0.41 |
| −4 | 4 | 4.71 | −0.71 | −0.75 | 0.45 |
Note: z-scores are derived from the means and the standard deviations of the residuals. Significant Z-scores are marked in bold.
We would contend that this method (and to some degree, the measure of absolute difference used in the present study) is somewhat limited in its ability to appropriately characterize gain because of the inherent inverse relationship between performance in the auditory-alone condition and the maximum derived benefit when it is expressed as a percent gain (see also Grant and Walden 1996). In other words, there is a strong bias in favor of the benefit at lower SNRs due to a simple ceiling effect. To parse this in more concrete terms, one might ask whether it is meaningful to state that the gain at a very low SNR (e.g., A = 2%; AV = 6%; gain = 300%) can really be considered equivalent to the gain at a higher SNR (e.g., A = 30%; AV = 90%; gain = 300%)? That is, could an improvement in recognition from 1-in-50 words to 3-in-50 words really equate with an improvement from 12-in-50 to 36-in-50? The issue becomes particularly acute at higher SNRs where the “room for gain” diminishes rapidly (ceiling effect). For example, the 800% gain shown for a SNR of −20 dB in graph A simply cannot be surpassed at any SNR where subjects perform above 12.5% in the auditory-alone condition, even if subjects were to perform perfectly during the AV condition.
In the speech perception literature, another definition of gain has therefore been more widely applied, one initially suggested by Sumby and Pollack (1954). It has the advantage of being independent of the auditory-alone (A) performance level and is defined as the difference score (AV-A) divided by the maximum improvement possible (100-A). This gain score is depicted in graph B of Figure 2. It shows the largest relative gain now located at the highest SNRs, in apparent opposition to the “inverse effectiveness principle.” Consistent with graph A, however, the data point at −12 dB again represents the only residual value that is significantly different from the others (z = 3.39; P < 0.001). Again, the curve fit is near perfect with R2 = 0.997 if we exclude the data point at −12 dB from the calculation.
Yet another way to characterize benefit is displayed in graph C. Here, gain is plotted in decibels. That is, from the plot in Figure 1, one can read off the intensity level required in the auditory-alone (A) condition to achieve the same recognition accuracy seen in the AV condition at any given SNR. For example, from the graph, we can estimate that at −12 dB, the gain from visual stimulation amounts to an increase in SNR of approximately 9 dB because AV recognition at −12 dB is 69%, and estimating the equivalent performance point on the auditory-alone curve leads to an estimate of −3 dB SNR. As with the previous 2 methods, the data point at −12 dB is again the only point that is not well fit by the curve, with a significant residual deviation (z = 2.0, P = 0.046). Leaving out the −12 dB data point as before improves the fit from an R2 = 0.71 to an R2 = 0.92. It should be noted that gain derived in this manner is likely to be dependent on the specific experimental parameters and stimulus materials used. For instance, Sumby and Pollack's data showed an AV gain that ranged from 5 to 22 dB depending on the size of the set of bisyllabic words used. MacLeod and Summerfield (1987) estimated a gain of 11 dB for the contribution of vision to the perception of spoken sentences. Here, gain is maximal at the lowest SNR and falls off with increasing SNR in general accordance with inverse effectiveness, but as before, there is once again a departure from a simple monotonic function at the −12 dB SNR.
In sum, while the approach to appropriately characterizing gain is still a matter of some disagreement in the literature, no matter which method is applied here, the gain around the −12 dB data point appears to represent a “special zone” for AV multisensory integration that does not accord with a strict interpretation of inverse effectiveness.
Previous Neuroimaging Studies
It is also noteworthy that the window of maximal integration in our study (at 20% intelligibility for the auditory-alone condition or −12 dB) is located precisely where Callan and others (2003) found increased activation in STS in their functional magnetic resonance imaging study. However, these authors interpreted their findings as evidence for the operation of inverse effectiveness in STS, whereas the present results show that the size of the gain due to AV interactions actually diminishes below this level. Given the present results, we would predict that at lower SNRs, multisensory regions like the STS would likely show less AV multisensory integration. However, it is worth stressing that significant and considerable AV enhancements continue to be present all the way down to the highest noise level used, even at a noise level at which words were completely unintelligible in the auditory-alone condition. This last point is remarkable in that it shows that under circumstances where word recognition is impossible on the basis of the auditory input alone, adjunctive visual input can cause substantial recovery of function beyond what is possible by speech-reading alone. Thus, although we would predict a drop in STS AV activation at lower SNRs, we would also predict that multisensory enhancement will persist at noise levels considerably higher than those used in the Callan and others (2003) study.
Further, the present data clearly show that only part of the performance gain introduced by visual articulation can be attributed to pure speech-reading. It was found that the gain from additional visual stimulation was correlated with speech-reading performance at low SNRs where the auditory signal was low, and speech-reading is likely to play an important role in the recognition of words in addition to any multisensory effect. At intermediate levels, however, where by far the greatest multisensory gain was seen, performance was not correlated with speech-reading scores.
Previous Behavioral Studies of Audiovisual Speech Integration
As was pointed out in the Introduction, a number of previous behavioral studies have investigated AV gain in speech recognition. Here, we go into more detail regarding how the present results relate to this previous literature. In an early study by O'Neill (1954), increased gain with decreasing SNR was found. However, SNRs stopped at a nominal −20 dB where fully 25% of the words were still recognizable in the auditory-alone condition. As such, this study cut off at almost exactly the same SNR level at which we also found maximal gain and it is probable, had O'Neill used lower SNRs, that gain would have begun to decrease as was found here. Binnie and others (1974) claimed to show the “greatest visual complement occurring at poorer SNRs.” Unfortunately, this contention was simply not supported by their data, where a closer look shows that word recognition was not greatest at the lowest SNR used (41% correct at −18 dB) but occurred at a more intermediate level (50% at −12 dB) (note that speech-reading performance in this study was very high (43%) due to the use of a very limited list of simple phonemic stimuli). In a similar vein, McCormick (1979) states that the contribution of vision is inversely related to the SNR, again despite the fact that gain is maximal in his data where intelligibility in the auditory-alone condition is at 24% and clearly decreases at lower SNRs.
A number of other studies have also investigated the contribution of vision to speech perception in noise with more complex stimuli such as sentences (e.g., MacLeod and Summerfield 1987; Grant and Seitz 2000). In the study by McLeod and Summerfield (1987), an average AV benefit of 11 dB was found. This study was explicitly designed to overcome the difficulties associated with the use of percent correct performance as a dependent measure, which can often give rise to floor or ceiling effects. Performance was assessed using the threshold, measured in decibels, at which a number of target words were detected within a given sentence. AV gain was then calculated as the difference in decibels between the auditory-alone and AV conditions. This design precludes assessment of AV gain across a spectrum of SNRs and therefore does not directly address the issue of interest here (one serious drawback of this method is that the same sentence has to be presented repeatedly starting at different SNRs for AV and auditory-alone conditions, possibly confounding thresholds between conditions). Grant and Seitz (2000) also found that visible speech improved the detection of speech but, likewise, AV gain was not assessed across different SNRs. These authors used a very limited stimulus set of only 3 target sentences. A general problem with the use of sentences is that contextual cues such as prosody, syntax, and context are likely to influence detection and recognition, factors that are difficult to control between conditions. In an earlier study by Grant and Braida (1991), subjects had to recognize target words in sentences over a variety of SNRs in wideband noise and filtered speech. Although the primary goal of the study was not the investigation of the locus of the AV benefit, the authors conclude that their findings are consistent with previous studies (O'Neill 1954; Sumby and Pollack 1954; Massaro 1987) indicating that the absolute contribution of speech-reading to audition is maximal when the auditory channel is greatly degraded. A closer look at the performance curves (% correct) for their A and AV conditions, however, reveals that the gain is maximal at about −10 dB and decreases at lower SNRs.
Taking these earlier behavioral studies together, we believe that a somewhat consistent pattern emerges. Some who have claimed that the greatest gains are to be found at the lowest SNRs actually did not test sufficiently low SNRs to warrant such a contention, whereas others who made similar claims are often not supported by their own data.
Conclusions
These results show that there is a delimited window within which visual speech signals enhance auditory speech comprehension maximally and that this occurs, not when the unisensory (auditory) input is weakest as would be the prediction under a strict interpretation of the inverse effectiveness principle, but rather, at more intermediate values. Nonetheless, it is clear from these data that substantial gain in multisensory speech enhancement is found at even the lowest SNRs, largely in keeping with the general predictions of inverse effectiveness, but it is also evident that there is an optimally tuned window, a special zone if you will, around an SNR of −12 dB where multisensory integration is additionally enhanced beyond the predictions of this principle. We would like to clarify that the originators of the inverse effectiveness principle did not explicitly predict that it would also apply to higher level functions such as speech recognition (Stein and Meredith 1993), but speech researchers have certainly applied the principle since then (e.g., Callan and others 2001, 2003; see Calvert and Lewis 2004) and early AV speech researchers implied a similar mode of operation (e.g., Sumby and Pollack 1954; Erber 1975). Of course, the principle of inverse effectiveness was devised based on observations in a subcortical structure specialized for detection and orientation. That is, the job of the SC is thoroughly different from that of the speech recognition system. Because the SC is specialized for initiating saccades to events or objects and is an essential component of the brain's orienting (and early warning system), inverse effectiveness for weak unisensory inputs is a highly useful property in this structure. The speech system, on the other hand, is not primarily concerned with detection. Rather, its purpose is recognition, which involves the classification of complex waveforms and their integration into semantically meaningful units.
This, however, does not imply that all cortical multisensory mechanisms will not obey this principle. For example, recent electrophysiological studies in both humans (e.g., Foxe and others 2000; Molholm and others 2002, 2004; Murray and others 2005) and nonhuman primates (e.g., Schroeder and Foxe 2002, 2004; Schroeder and others 2004; Foxe and Schroeder 2005) have shown extremely rapid multisensory interactions in early sensory processing regions, and these early interactions may well be involved in detection and orientation processes, like those of the SC, where inverse effectiveness would be highly advantageous. However, this remains to be directly assessed.
It is reasonable to propose that there are minimal levels of auditory input necessary before recognition can be most effectively enhanced by concurrent visual input. These data suggest that the speech recognition system appears to be maximally tuned for multisensory integration at SNR levels that contain these minimal levels of input—that is, there is a window of maximal multisensory integration at intermediate levels. As such, we contend that maximal multisensory tuning for speech recognition does not strictly adhere to the inverse effectiveness principle.
Support for this work was provided by grants to JJF from the National Institute of Mental Health (MH65350) and the National Institute on Aging (AG22696). The authors would like to express their sincere thanks to Dr Sophie Molholm for her ever-valuable comments on earlier versions. We would also like to thank our good friend Dr Alex Meredith for his challenging comments and 2 anonymous reviewers for their helpful suggestions. Conflict of Interest: None declared.