


Abstract
We recorded directly from the amygdalar nucleus of nine epileptic patients performing a delayed odor-matching recognition memory task. Time–frequency analysis of the responses to the odorants revealed that the stimulations elicited induced oscillatory responses, as well as already described olfactory evoked potentials. These oscillatory responses were composed of two frequency components — one in the beta band (15–25 Hz) and a faster one, in the low gamma band (25–35 Hz) — both of which lasted during the full duration of the inspiration. In pairs of identical odorants, the power of gamma oscillations was weaker for the second odorant (the target) than for the first one (the sample). We observed no such difference when the first and second odorants of a pair were different. Thus, gamma oscillations in the amygdala are weaker for repeated stimuli, a mechanism known as repetition suppression. This is consistent with an involvement of the human amygdala in the encoding and retrieval of olfactory information independently of its hedonic properties, at least in epileptic patients. Altogether, our results corroborate in humans evidence found in animals that oscillations serve as a common coding process of olfactory information.
Introduction
How does the human brain process olfactory information? The clinical investigation of the effect of focal brain lesions, as well as neuroimaging studies using functional magnetic resonance imaging (fMRI) and positron emission tomography (PET), has helped to identify a set of critical structures involved in olfactory processing (Zatorre and Jones-Gotman, 1991, 2000; Zatorre et al., 1992; Zald and Pardo, 2000; Royet and Plailly, 2004). While the olfactory bulb and perhaps regions of the primary olfactory cortex such as the anterior olfactory nucleus and olfactory tubercle can carry out basic functions such as odor detection, other brain regions seem to be involved in higher-order olfactory processing. Olfactory memory, for instance, activates a neural network including the piriform and orbitofrontal cortices and the hippocampus (Dade et al., 2002; Gottfried et al., 2002, 2004; Wilson and Stevenson, 2003; Plailly et al., 2005). The inferior frontal gyrus is involved in identification of semantic representations of odors (Royet et al., 1999; Kareken et al., 2003; Savic and Berglund, 2004). Emotions induced by odors activate a complex neural circuit, involving the amygdala, the insula and the left orbitofrontal cortex (Zald and Pardo, 1997; Anderson et al., 2003; Royet et al., 2003). Although very informative, lesion and cerebral imaging studies have produced evidence of olfactory neural networks only in terms of spatial localization.
A better understanding of the olfactory networks requires the investigation of their dynamics. Time-resolved electrophysiological studies allow the assessment the latencies, durations and order of activations of each olfaction-related brain region. They further enable the spectral structure of those activations, that is, whether they involve neural oscillations in specific frequency ranges, to be understood (Singer, 1999; Tallon-Baudry and Bertrand, 1999; Lachaux et al., 2000; Engel and Singer, 2001). All this complexity cannot be seen with functional imaging techniques since they project local neural responses down to single metabolic activation values. Numerous studies performed in animals have shown that oscillations may intervene in the coding of olfactory information in the olfactory bulb and rhinal cortices (Freeman et al., 1983; Freeman and Viana Di Prisco, 1986; Laurent, 2002; Buonviso et al., 2003). For instance, in insects, repeated odor sampling leads to a decrease in response strength, accompanied by a progressive synchronization of the oscillatory responses recorded in the antennal lobe, an analogue of the olfactory bulb (Stopfer and Laurent, 1999). In other sensory modalities, high-frequency oscillations (the so-called gamma-oscillations >30 Hz) have been related to numerous cognitive operations and particularly top-down processing like the holding of visual information in short-term memory (Tallon-Baudry and Bertrand, 1999; Engel et al., 2001; Tallon-Baudry et al., 2001).
Due to clinical constraints, time-resolved human electrophysiological studies can be carried with precise anatomical resolution only in a small number of patients (Lachaux et al., 2003). This is probably why the dynamics of olfaction and the possible role of neural oscillations have been rarely documented in humans. The frequent exploration with intracerebral EEG electrodes of the medial temporal lobe of epileptic patients candidate for surgery provides an exceptional opportunity to investigate the timing of some elements of the human olfactory networks.
In a series of such recordings performed by our group, we found that the presentation of odorants generated an olfactory evoked potential (OEP), followed by a strong oscillatory response in the amygdala (Hudry et al., 2001). This study confirmed earlier observations that described amygdalar oscillations in response to odorants without describing their exact timing (Halgren et al., 1977; Hughes and Andy, 1979). However, our previous study focused primarily on the characteristics of the evoked potential (Hudry et al., 2001), and the functional role of those amygdalar oscillations induced by odorants is still unknown. In this paper, we investigate in detail the properties of the oscillatory response component in this memory task. We used time–frequency analysis to reanalyse the human intracranial data recorded by Hudry et al. (2003) during a delayed match-to-sample task. We hypothesized that odorant-induced amygalar oscillations may be a neural correlate of local olfactory processing, and should vary according to the type of olfactory processing: encoding versus recognition. Using time–frequency analysis, we found that low-gamma (25–35 Hz) oscillations induced in the amygdala are reduced by the repetition of identical stimulations, indicative of a possible repetition-suppression mechanism. This observation suggests that the amygdala may be involved in short-term olfactory memory.
Materials and Methods
Patients
Eighteen patients (13 females) investigated with SEEG for therapeutic purposes participated in the study. All patients were right-handed. None of the patients suffered from nasal pathology, nor smell disturbance or chronic ear, nose and throat disease. The experimental procedure was made at least 24 h until any clinical seizure. These patients were all affected by pharmaco-resistant partial epilepsy. This intracranial procedure included the stereotactic implantation from 6 to 15 depth electrodes in various intracerebral sites. The choice of the sites of implantation was made upon preoperative data, including MRI, video-scalp monitoring, fluorodesoxyglucose PET and ictal SPECT. Of the 18 patients, nine were excluded from the study because of: (i) epileptic discharges during the test and/or frequent interictal spikes in the amygdala; and (ii) frequent artifacts precluding time–frequency analysis. All patients gave their fully informed consent to participate in the study, which did not involve any invasive procedure other than that of the intracranial EEG recordings routinely performed in our department.
SEEG Procedure
Electrodes implantation was realized following the method of Bancaud and Talairach (1973). The electrodes were implanted while the patient's head was fixed with a stereotactic frame using a planar grid parallel to the midline vertical of the Talairach's stereotactic atlas (Talairach and Tournoux, 1988). Thus, all the electrode tracks were perpendicular to the midline vertical plane. Each electrode had between 5 and 15 contact sites within the tissue, consecutive sites being separated 3.5 mm apart (centre to centre). The anatomical location was determined by the superimposition of the frontal skull X-rays with the electrodes in place and the frontal MRI slice corresponding to each set of electrode coordinates. In seven patients, the amygdala was implanted unilaterally (five in the right amygdala, two in the left amygdala) and in two patients, the amygdala was implanted bilaterally.
Experimental Procedure
The experimental procedure consisted of a delayed match-to-sample recognition task, as detailed in Hudry et al. (2003). Briefly, the test was performed between days 5 and 7 following electrode implantation. Twenty-four odorants were used in the present study, selected from those found to be unfamiliar in a previous study with 71 healthy subjects (Royet et al., 1999). They also presented similar subjective intensity ratings and neutral hedonic ratings, so that in principle they could not be discriminated solely from these characteristics. The judgements on odorants were not assessed in our patients group (the post-hoc collection of these ratings could not be obtained in the epilepsy patients). The odorants were contained in 20 ml yellow glass bottles with polyethylene screw lids (Fischer, Erlancourt, France). An odorant solution (10%) was obtained by diluting 0.5 ml of product in 4.5 ml of an odourless solvent (mineral oil). It was placed in the bottle and absorbed by compressed filaments of polypropylene.
Sixteen pairs of odorants were presented in successive trials, 120 s apart. A trial consisted of a sample odorant (encoding condition) and a target odorant (retrieval condition). The inter-stimulus interval was fixed at 30 s, an interval sufficient to prevent sensory adaptation (Jehl et al., 1994). In eight trials the sample odorant matched the target odorant, and in the other eight trials the sample odorant mismatched the target odorants. The trials were presented in a pseudo-random order that was identical for all patients.
Each odorant was administered monorhinally in the nostril ipsilateral to the epileptogenic focus, while the patients held the controlateral nostril closed with a finger. Before the experimental procedure, the patients were instructed on how to breathe the odorants. The patients were asked to breathe in evenly with the glass bottle containing the odorant just under the stimulated nostril. The patients had to keep a steady respiratory rhythm during the stimulations. The presentation time of the odorants (defined by the inhalation duration) varied from 4 to 5 s. After smelling the second odor of each pair, the patients were asked to judge whether the odors of the pair matched or not. The respiratory signal of each patient was monitored with a low-pressure airflow sensor.
Recording and Data Analysis
Intracerebral recordings were conducted using an audio-video-EEG monitoring system (Micromed, Treviso, Italy), which allowed the simultaneous recording of 96 depth-EEG channels sampled at 128 Hz with an analogue filter band-pass of 0.3–64 Hz. The electrophysiological signal was recorded from electrodes implanted stereotactically in either the right or th left amygdala, and were referenced to the contact of another depth electrode located extracortically near the skull. Trials showing epileptic spikes were discarded from the analysis.
OEP Analysis
OEPs were calculated off-line separately for sample odorants of matching and mismatching pairs, and for target odorants of matching and mismatching pairs. The stimulus onset was defined as the first onset of the inspiration of the respiratory signal during odorant presentation. The stimulus onset was therefore determined by the end of a flat line in the breathing signal that corresponded to the end of the expiration through the mouth.
The OEPs were composed of two main components that were consistent across subjects: a first positive peak around 300 ms followed by a negative peak around 540 ms. OEP analysis was realized on the amygdalar contact with the largest OEP.
Time–Frequency Analysis
For each patient, single trial time–frequency (TF) maps were averaged across three different stimulus groups to produce six average TF maps: either across all the odorants with a similar position in their pair [all the sample (i.e. first) stimuli or all the target (i.e. second) stimuli] to provide sample (1) and target (2) average TF maps, across all the target odorants that did not match their sample odorants [mismatch target average TF map (3)], across all the target odorants that did match their sample odorants [match target average TF map (4)], across all the sample odorants that did not match their target odorants [mismatch sample average TF map (5)] or across all the sample odorants that did match their target odorants [match sample average TF map (6)]. For visualization purposes only, those average TF maps were normalized frequency by frequency relative to a pre-stimulus baseline according to the following procedure (z-transform): (i) we computed for each frequency f the mean m(f) and the standard deviation s(f) of the average TF map over a [−4000 to −1000 ms] prestimulus baseline; and (ii) for each average TF map, each energy value at frequency f and time t, P(t,f) was replaced by (P(t,f) − m(f))/s(f). For each patient, these time–frequency maps were computed for each contact.
The statistical analyses focused on the comparison between the raw values of post-stimulus TF energies respectively measured in (i) the sample and target average TF maps; (ii) the mismatch and match target average TF maps; (iii) the mismatch target and mismatch sample average TF maps; and (iv) the match target and match sample average TF maps. An initial visual inspection of the TF maps revealed the presence of two distinct oscillatory components in the response (see Fig. 3): a first one in the beta range in a TF region of interest (TFROI) covering [1000–6000 ms] and [15–25 Hz] and a second one in the gamma range in a TFROI covering [1000–6000 ms] and [25–35 Hz]. We focused the statistical analysis on those two TFROIs. Eight analyses were performed (two TFROIs × the four comparisons defined above) using non-parametric paired Wilcoxon Rank tests, that each time compared two series of nine values (corresponding to the nine patients). Correlations between the OEP amplitudes and the gamma band response energies were computed with the non-parametric Spearman Rank Correlation test. Electrophysiological analysis were made by the software package for electrophysiological analysis (ELAN-Pack) developed in the INSERM U280 laboratory.
Results
Recordings from the Amygdala
All nine patients performed the delayed match-to-sample recognition test successfully. None of them exhibited epileptiform discharges or spikes evoked by odorant stimulations in the amygdala. The mean number of correctly recognized pairs of odorants was 12 ± 2.73 (mean ± SD), corresponding to 75% of the pairs. Those behavioral results were compared with those of a control group in a previous study (Hudry et al., 2003).
Olfactory Evoked Potentials
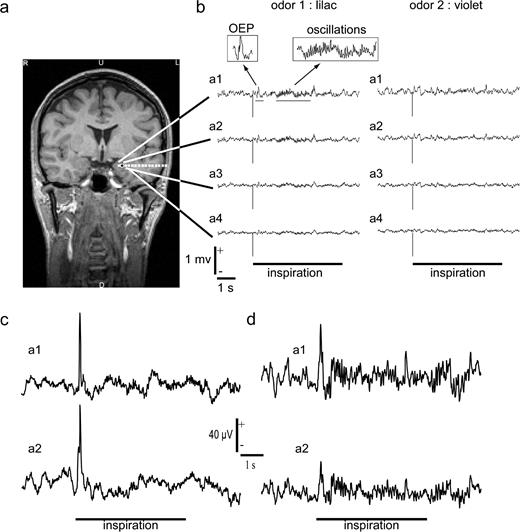
All odorants (both sample and target stimulations) generated in each patient an OEP in the recorded amygdala (Fig. 1). Those OEPs had two components — an early positive peak and a later negative peak — which were often visible in single trials. The OEPs were usually recorded in the four deepest contacts of the amygdala electrode, with the amplitude of the positive peak decreasing from the deepest one to the more superficial one, in the referential recordings (i.e. monopolar). In our recordings, the OEPs were specific to the amygdala and were not observed in any other contact outside this structure within our field of exploration.
Example of electrophysiological recordings in three patients (Pt1, Pt2, Pt3) collected from the amygdalar nucleus. (a) Coronal MRI showing the electrode implanted in the left amygdala of Pt1. The four deepest contacts (a1, a2, a3, a4) were located inside the amygdala. Black contact: site of maximal energy of gamma oscillations induced by the odorants. (b) Raw monopolar recordings obtained after the presentation of two odorants of a pair (lilac and violet) in the amygdala of Pt1. The stimulus onset is at 0 ms (vertical bar). Horizontal bar: duration of stimulus presentation used for statistical analyses. The two enlarged boxes show the OEPs and the subsequent oscillatory response. (c) Raw monopolar recordings obtained after the presentation of one odorant of a pair in the amygdala of Pt2. Responses in the two deepest contacts are shown (a1, a2). Horizontal bar: duration of stimulus presentation used for statistical analyses. (d) Raw monopolar recordings obtained after the presentation of one odorant of a pair in the amygdala of Pt3. Responses in the two deepest contacts are shown (a1, a2). Horizontal bar: duration of stimulus presentation used for statistical analyses.
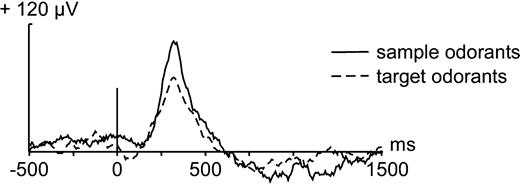
In the amygdala, the mean latency of the positive peak (P1) of the OEPs elicited by the sample odorants was 349 ± 43 and 305 ± 82 ms for the target odorants, although this difference in latency did not reach significance (P = 0.06, paired Wilcoxon Rank test), probably because of the small number of patients (Fig. 2). The amplitude of P1 was 103 ± 43 μV for sample odorants and 67 ± 32 μV for target odorants, wich represented a significant difference of amplitude (P = 0.02). The amplitude of the P1 evoked by matching targets was reduced as compared with matching samples (P = 0.01). The amplitude of the P1 was not different between mismatching targets and mismatching samples (P > 0.05). The N2 amplitude was also reduced for target odorants as compared with sample odorants (P = 0.04).
Monopolar OEPs obtained from the amygdala in response to the 16 sample odorants (solid line) and to the 16 target odorants (dotted line), averaged across the nine patients. The vertical bar shows the stimulus onset.
Oscillatory Components of the Olfactory Response
Besides the OEPs, all odorants (samples and targets) elicited oscillatory responses in the amygdala. They were clearly visible in the raw intracerebral EEG data (Fig. 1) and could last until the end of the stimulation (as defined from the respiratory signal). As for the OEPs, these oscillatory bursts were recorded on the deepest contacts of the amygdala electrode. The oscillations usually started after the principal positive peak of the OEPs.
The peak frequency of the oscillatory response induced by odorants was 19.5 ± 9.0 Hz for the sample odorants, 20.2 ± 9.5 Hz for the target odorants, 18.3 ± 8.2 Hz for the matching target odorants and 19.2 ± 9.1 Hz for the mismatching target odorants. The mean peak frequency was not statistically different between those conditions (P > 0.05, paired Wilcoxon Rank test).
Figure 3 shows the mean time–frequency maps of the amygdalar response averaged across the nine patients for all odorants divided into four stimulation classes: (i) sample odorants (Fig. 3a); (ii) target odorants (Fig. 3b); (iii) target odorants that matched their sample odorants (Fig. 3c); and (iv) target odorants that mismatched their sample odorants (Fig. 3d). Olfactory stimulations induced strong oscillations components in the amygdala, with a mean Z-score of 10 or more compared with the [−4000 to −1000 ms] baseline prestimulation period. In addition to a low frequency component (<15 Hz) that corresponds to the TF trace of the OEP, the TF maps revealed two main oscillating components above 15 Hz: one in the beta range (15–25 Hz) and one in the low gamma range (25–35 Hz). The energy of both components decreased progressively until the end of respiratory modulations, several seconds after the stimulus onset.
![Mean time–frequency responses to odorants inside the amygdala averaged across the nine patients. The normalized time–frequency maps display the increase of power relative to the [−4000 to −1000 ms] baseline (in standard deviations). The stimulus onset is at 0 s. (a) mean response to all the sample odorants. (b) Mean response to all the target odorants. (c) Mean response to the target odorants matching their sample odorants. (d) Mean responses to the target odorants mismatching their sample odorants. Notice the low-frequency component (<10 Hz) corresponding to the time–frequency trace of the OEPs and the high-frequency component (from 15 to 40 Hz). This high frequency component was composed of a beta component [15–25 Hz] and a gamma component [25–35 Hz] which were considered separately for statistical analyses.](https://oup.silverchair-cdn.com/oup/backfile/Content_public/Journal/cercor/16/1/10.1093/cercor/bhi090/2/m_cercorbhi090f03_ht.jpeg?Expires=1716530969&Signature=Zq68~d1K0N6ApyM7OsZ1SPBb39Jg34lxBW-phHnqYpZDoLZg6jB~IEK92sSg178zOrvRkimD55aukph9~hypww9vkpIuwSTzdQc7rWqK-UyhxdBv621qJ2qIDFVK2AW~f3XVjT7YJz5IQMr6xQ~CbMLy4w-Qel2QmJIMf95rIsRdxcC9Sc-h1bOmEtgUa4lWE-PRADdThdXfs8tozYOIwEEfnhE24N2jnn8CZ-cgIAmz-jHo0o4ksGQ58JwM1-piuAH-nZgFSk8gORqhX-vWk5SdfxWQQOx0t3OP8uuCHJ60OT-nqA8VbpexYY4RWptJmxHL54~woVm09AKl7nJH6g__&Key-Pair-Id=APKAIE5G5CRDK6RD3PGA)
Mean time–frequency responses to odorants inside the amygdala averaged across the nine patients. The normalized time–frequency maps display the increase of power relative to the [−4000 to −1000 ms] baseline (in standard deviations). The stimulus onset is at 0 s. (a) mean response to all the sample odorants. (b) Mean response to all the target odorants. (c) Mean response to the target odorants matching their sample odorants. (d) Mean responses to the target odorants mismatching their sample odorants. Notice the low-frequency component (<10 Hz) corresponding to the time–frequency trace of the OEPs and the high-frequency component (from 15 to 40 Hz). This high frequency component was composed of a beta component [15–25 Hz] and a gamma component [25–35 Hz] which were considered separately for statistical analyses.
Gamma Oscillations
We measured the latency at half of the maximal energy of the oscillations, the half-height latency, in each experimental condition. The half-height latency of the response in the gamma range was 1625 ± 455 ms for the sample odorants, 1587 ± 666 ms for the target odorants, 1612 ± 679 ms for the matching targets and 1637 ± 669 ms for the mismatching targets. There was no difference in half-height latency of the gamma responses across those different conditions (P > 0.05, paired Wilcoxon Rank test). The statistical analyses revealed that the energy of the low gamma oscillations was greater for sample odorants than for target odorants in the TFROI [1000–6000 ms post-stimulus; 25 – 35 Hz] (P = 0.03, paired Wilcoxon Rank test). This difference was also significant when we included in the analysis only the stimulations that were correctly recognized (P = 0.02). In addition, among the target odorants, the mismatching odorants induced stronger gamma oscillations than the matching odorants (in the same TFROI [1000–6000 ms] × [25–35 Hz]). This difference was significant, once again, whether it applied to all the target odorants (P = 0.03) or only to the target odorants correctly recognized (P = 0.03).
We then compared, for the matching pairs, the energy of the gamma oscillations induced by the sample and their corresponding (identical) target odorants. In those matching pairs, sample odorants elicited stronger gamma oscillations than the subsequent target odorants (P = 0.02). In contrast, there was no significant difference between sample and target odorants in mismatching pairs (P > 0.05).
There was also no difference in peak frequency or in half-height latency between the responses in the left amygdala (n = 7 right amygdala) and the right amygdala (n = 4 left amygdala) (comparison between the two subpopulations of amygdalar recordings, with two bilateral patients included in both groups).
Finally, we tested for a significant correlation between the amplitude of the OEPs and the energy of the low gamma band response, but found none (P > 0.05).
Beta Oscillations
The half-height latency of the response in the beta range was 1856 ± 678 ms for sample odorants, 1637 ± 796 ms for target odorants, 1512 ± 807 ms for matching targets and 1837 ± 740 ms for mismatching targets. There was no difference in half-height latency of the beta responses across those different conditions (P > 0.05). For the comparisons of energy of oscillations in the beta range, we performed exactly the same tests for the other TFROI in the beta band ([1000–6000 ms] × [15–25 Hz]) and found no significant differences between stimulus types (P > 0.05).
Lateralization of the Oscillatory Responses
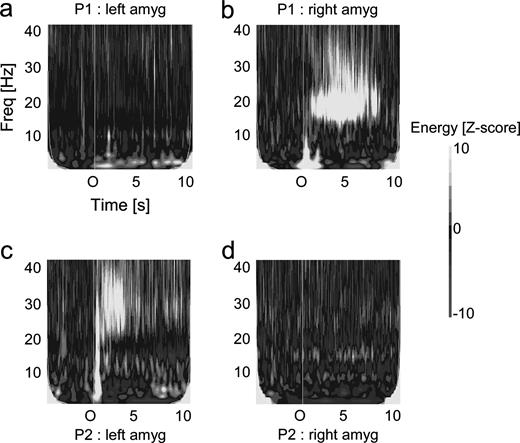
Two patients underwent a bilateral stereotactic implantation of both amygdalar nuclei. This opportunity allowed us to assess the lateralization of the amygdalar oscillations after monorhinal olfactory stimulations. One of the two patients was stimulated in the right nostril (with a right epileptogenic focus) and the other patient in the left nostril (with a left epileptogenic focus). In both cases, the oscillations induced by olfactory stimulations were solely located in the amygdala ipsilateral to the stimulated nostril (Fig. 4).
Lateralization of the amygdalar oscillations induced by the odorants in the two patients with a bilateral implantation of the amygdala. Top: responses in a patient with a right nostril stimulation. (a) Response in the left amygdala. (b) Response in the right amygdala. Bottom: same for a patient with a left nostril stimulation. (a) Response in the left amygdala. (b) Response in the right amygdala.
Influence of the Breathing Pattern
One possible concern with those results is that the difference in gamma energy between stimulation classes could be due to differences in the breathing amplitude. To control for such an effect, we measured, for each odor, the amplitude of the respiratory signal during the first 5 s following the stimulus onset (precisely, the norm of the respiratory signal after removal of its mean), then averaged those values across stimuli of the same class to provide an estimate of the breathing amplitude for that class. For each patient, this amplitude was compared for sample versus target odorants, and there was no significant difference across the nine patients (P > 0.05). Also, there was no significant difference across the nine patients between the respiration amplitudes for the matching versus mismatching target odorants (P > 0.05). There was also no difference between the respiration amplitudes of the matching samples versus matching target and between mismatching targets versus mismatching samples (P > 0.05). Therefore, the differences observed between stimulus conditions in the gamma band could not be attributed to differences in respiratory patterns.
Discussion
Our study confirms from direct electrophysiological recordings that in humans, the amygdala is responsive to odorous stimuli usually described as unfamiliar and hedonically neutral. In our sample of epileptic patients, the spectrum of amygdalar responses comprises both OEPs and induced oscillations. The induced oscillations split into two frequency bands, the beta range (15–25 Hz) and the low gamma range (25–35 Hz), and last during all the inspiratory phase (4–5 s), in contrast with the OEPs. In the gamma range, the oscillatory component proved to be dependent on the position and similitude of odorants within each pair, suggesting a role of amygdalar nucleus in olfactory memory.
Involvement of the Amygdala in Odor Memory
The amygdala is known to be central to olfaction. The amygdalar nucleus receives massive olfactory projections (Swanson and Petrovich, 1998): the main olfactory system component of the amygdala receives its main inputs from the olfactory bulb plus inputs from the primary (piriform cortex) and secondary olfactory areas (the orbitofrontal and insular cortices), and from medial prefrontal, perirhinal and hippocampal cortical areas (Carmichael et al., 1994; Bruce and Neary, 1995; Petrovich et al., 1996; Shipley and Ennis, 1996). There is strong evidence that the amygdala can modulate memory consolidation via its many connections with regions of the brain involved in mnemonic processing, such as the hippocampus, rhinal cortices and ventral stritatum (Cahill and McGaugh, 1998; Cahill et al., 2001). Further, animals studies have shown that the bilateral inactivation of the baso-lateral amygdala abolishes olfactory learning (Cahill and McGaugh, 1998; Cahill et al., 2001; Kilpatrick and Cahill, 2003). The amygdala could mediate the behavioral relevance of sensory stimulations by providing values to olfactory cues predicting positive or negative outcomes. In humans, it was observed that a selective bilateral damage of the amygdala resulted in severe impairment in odor-paired associative learning, odor–name matching and odor–odor recognition memory (Markowitsch et al., 1994; Buchanan et al., 2003), also supporting the view that the human amygdala is implicated in the memorization of behaviorally significant odors.
Olfactory-induced Oscillations
The oscillations that we observed had already been described in humans in a few other EEG studies, even though their exact functional significance was never elucidated (Narabayashi et al., 1963; Halgren et al., 1977; Hughes and Andy, 1979). Hughes and Andy (1979) studied the responses to seven different odorants and found that the stimulations induced broadband frequencies oscillations (40–70 Hz) in the amygdala. They considered the 40–70 Hz component as the most likely related to sensory processing, as it provided the more distinctive and common patterns related to odorant stimulations. Using single and multiple units electrodes, Halgren et al. (1977) found changes in the firing rate in the amygdala during sniffing from both empty and odorous flasks. This led them to suggest that the amygdalar nucleus response reflects more cardiovascular and respiratory regulations than sensory processing. Our study does not give support to this hypothesis because odorant-induced oscillations did not vary like the amplitude of the respiratory pattern in the amygdala; the repetition of stimulations decreased the power of gamma oscillations while respiratory intensity remained constant.
We found the oscillations to be restricted to the amygdala. However, this does not preclude the fact that they could be present elsewhere, in regions not recorded in this study. They could also be driven by neighbouring structures, such as perirhinal cortex and the piriform cortex. For instance, it has been shown in cats that the lateral amygdala and the perirhinal cortex can exhibit spontaneously phase-related oscillations, supporting the genesis of coherent neuronal activities at various frequencies between these two structures (Collins et al., 2001). Moreover, it would be interesting to test whether the piriform cortex, which was recently found to be involved in odor memory (Dade et al., 2002; Gottfried et al., 2004; Plailly et al., 2005), could generate such oscillations and whether they are phase-locked with the amygdala.
In the two patients with a bilateral stereotactic implantation of both amygdala nuclei, oscillations were recorded only in the amygdala ipsilateral to the stimulated nostril. We acknowledge that any interpretation on lateralization of the olfactory processing in the amygdala is obviously limited by the patient epileptic condition. However, as shown in our patients, the strongest oscillatory response was observed in the amygdala ipsilateral to the epileptogenic focus. This could suggest that the observed oscillatory lateralization is not solely due to a functional inhibition of the epileptogenic amygdala. This lateralization of the olfactory responses is in agreement with anatomical studies showing that the central olfactory connexions to the primary olfactory structures, such as the amygdala, are predominantly ipsilateral to the stimulated side (Carmichael et al., 1994).
Role of Amygdalar Oscillations in Odor Memory
What physiological mechanism could amygdalar oscillations index? It has been postulated that amygdalar oscillations play a crucial role in the consolidation of emotionally arousing stimuli by promoting synaptic plasticity and cooperation among various neocortical sites (Collins et al., 2001). Nevertheless, (i) we used rather hedonically neutral and unfamiliar stimuli (at least, judged as such by a population of 71 normal subjects); and (ii) we found a modulation of gamma oscillations with the sample target factor, whereas hedonicity did not covary with this factor. It therefore seems unlikely that amygdalar oscillations reflect only a reaction to the emotional intensity of odorants. For the same reasons, gamma oscillations do not simply index the intensity of the odorants. However, intensity and hedonicity ratings based on healthy controls subjects are not necessarily applicable to epilepsy patients with medial temporal damage since data suggest that amygdala may encode odor intensity or hedonicity. It is therefore possible that the comparisons between matching and mismatching odorant sets could be due to perceived differences in intensity or hedonicity, rather than to differences in stimulus matchability. One possibility is that oscillations above 20 Hz participate in the mnemonic rehearsal of olfactory information, as this has already been found for visual stimuli (Tallon-Baudry and Bertrand, 1999; Tallon-Baudry et al., 2001) during the short-term maintenance of visual objects. Gamma oscillations may thus be related to top-down processes such as active attentional modulation or memory maintenance (Engel et al., 2001). In this regard, it is worth noting that the gamma band components that have been associated with top-down influences often extend in frequencies higher than the ones accessible in this study. Further studies on the present topic should therefore use sampling frequencies higher than 128 Hz (preferably above 500 Hz).
An alternative explanation could be a peripheral adaptation (at the nose level, for instance). However, the inter-stimulus interval was set to 30 s, an interval which is known from previous studies (Jehl et al., 1994) to be sufficient to prevent sensory adaptation. Second, adaptation seems to produce effects less stimulus-specific that those we observed: when measuring, using scalp EEG recordings, the potentials evoked by two consecutive olfactory stimulations, the potential evoked by the second stimulation had a smaller amplitude than the potential evoked by the first one, even if the two odorants were different, as with a cross-adaptation effect (Pause and Krauel, 2000). Indeed, we did not observe such a cross-adaptation effect (which would be inconsistent with a role in memory), but found an effect more consistent with a self-adaptation phenomenon, since the diminution in oscillations amplitude occurred only for pairs of identical odors.
Finally, one interpretation of the functional role of the oscillations in the amygdala is that they may participate in a repetition-suppression mechanism that subserves short-term memory (Desimone, 1996; Hudry et al., 2003). As for OEPs, we showed that the reduction of gamma oscillations energies between sample and target stimuli was present only when identical stimuli were presented (matching pairs), but not when these stimuli were different (mismatching pairs). We therefore postulate that these modulations can be related to a perceptual priming such as the neural mechanism of repetition suppression, which is a reduction of the neural firing rate to repeated stimuli. Desimone (1996) suggested that this effect is a by-product of a ‘sharpening’ of a stimulus representation in the cortex. With stimulus repetition, the neural network becomes sparser and more selective to the stimuli. Interestingly, a repetition suppression effect on gamma oscillations has been shown previously in the visual modality using scalp EEG in humans (Gruber and Muller, 2002). Our study may thus extend these results to the olfactory system.
We can also not rule out that the gamma modulations were related to a decrease of attentional load for identical stimuli. Matching target odorants could indeed be less attention catching than mismatching ones, and could thus lead to a reduced oscillatory synchronization. The decrease in response for repeated odorants may also suggest that the amygdala is involved in novelty detection. In previous neuroimaging studies, the amygdala has been shown to be sensitive to novelty in various sensory modalities (Zald, 2003). In all cases, these results suggest that the amygdala keeps a neural trace of previous odorants and may therefore play a role in olfactory short-term memory.
Conclusion
In animals, oscillations are thought to play a role in the coding of behaviorally significant olfactory events, for instance those experimentally associated with a reward or following repeated presentations of the same odor during learning (Freeman and Schneider, 1982; Perez-Orive et al., 2002; Ravel et al., 2003; Martin et al., 2004). The present study supports for the first time that oscillations may also participate in coding mechanisms in the human olfactory system. In particular, the 25–35 Hz oscillations recorded in the amygdala could participate in the encoding and retrieval of olfactory information, possibly via a ‘repetition suppression’ mechanism.
This study was funded by grants from the Fondation pour la Recherche Médicale. J.P.L. was funded by a grant from the Fyssen Fondation.
References
Anderson AK, Christoff K, Stappen I, Panitz D, Ghahremani DG, Glover G, Gabrieli JD, Sobel N (
Bancaud J, Talairach J (
Bruce LL, Neary TJ (
Buchanan TW, Tranel D, Adolphs R (
Buonviso N, Amat C, Litaudon P, Roux S, Royet JP, Farget V, Sicard G (
Cahill L, McGaugh JL (
Cahill L, McGaugh JL, Weinberger NM (
Carmichael ST, Clugnet MC, Price JL (
Collins DR, Pelletier JG, Pare D (
Dade LA, Zatorre RJ, Jones-Gotman M (
Desimone R (
Engel AK, Singer W (
Engel AK, Fries P, Singer W (
Freeman WJ, Schneider W (
Freeman WJ, Viana Di Prisco G (
Freeman WJ, Viana Di Prisco G, Davis GW, Whitney TM (
Gottfried JA, Deichmann R, Winston JS, Dolan RJ (
Gottfried JA, Smith AP, Rugg MD, Dolan RJ (
Gruber T, Muller MM (
Halgren E, Babb TL, Crandall PH (
Hudry J, Ryvlin P, Royet JP, Mauguiere F (
Hudry J, Perrin F, Ryvlin P, Mauguiere F, Royet JP (
Hughes JR, Andy OJ (
Jehl C, Royet JP, Holley A (
Kareken DA, Mosnik DM, Doty RL, Dzemidzic M, Hutchins GD (
Kilpatrick L, Cahill L (
Lachaux JP, Rodriguez E, Martinerie J, Adam C, Hasboun D, Varela FJ (
Lachaux JP, Rudrauf D, Kahane P (
Laurent G (
Markowitsch HJ, Calabrese P, Wurker M, Durwen HF, Kessler J, Babinsky R, Brechtelsbauer D, Heuser L, Gehlen W (
Martin C, Gervais R, Hugues E, Messaoudi B, Ravel N (
Narabayashi H, Nagao T, Saito Y, Yoshida M, Nagahata M (
Pause BM, Krauel K (
Perez-Orive J, Mazor O, Turner GC, Cassenaer S, Wilson RI, Laurent G (
Petrovich GD, Risold PY, Swanson LW (
Plailly J, Bensafi M, Pachot M, Delon-Martin C, Rouby C, Segebarth C, Royet JP (
Ravel N, Chabaud P, Martin C, Gaveau V, Hugues E, Tallon-Baudry C, Bertrand O, Gervais R (
Royet JP, Koenig O, Gregoire MC, Cinotti L, Lavenne F, Le Bars D, Costes N, Vigouroux M, Farget V, Sicard G, Holley A, Mauguiere F, Comar D, Froment JC (
Royet JP, Plailly J, Delon-Martin C, Kareken DA, Segebarth C (
Savic I, Berglund H (
Singer W (
Talairach J, Tournoux SF (
Tallon-Baudry C, Bertrand O (
Tallon-Baudry C, Bertrand O, Delpuech C, Permier J (
Tallon-Baudry C, Bertrand O, Fischer C (
Wilson DA, Stevenson RJ (
Zald DH (
Zald DH, Pardo JV (
Zald DH, Pardo JV (
Zatorre RJ, Jones-Gotman M (
Zatorre RJ, Jones-Gotman M (
Author notes
1INSERM U280, Mental processes and brain activation. 151 Cours Albert Thomas, 69003, Lyon, France, 2Functional Neurology and Epileptology Department, Research Unit EA 1880, Neurological Hospital, Lyon, France and 3Neurosciences and Sensory Systems Laboratory, Claude-Bernard University, Lyon, France