


Abstract
To evaluate the effect of an abstract motivational incentive on top-down mechanisms of visual spatial attention, 10 subjects engaged in a target detection task and responded to targets preceded by spatially valid (predictive), invalid (misleading) or neutral central cues under three different incentive conditions: win money (WIN), lose money (LOSE), and neutral (neither gain nor lose). Activation in the posterior cingulate cortex was correlated with visual spatial expectancy, defined as the degree to which the valid cue benefited performance as evidenced by faster reaction times compared to non-directional cues. Winning and losing money enhanced this relationship via overlapping but independent limbic mechanisms. In addition, activity in the inferior parietal lobule was correlated with disengagement (the degree to which invalid cues diminished performance). This relationship was also enhanced by monetary incentives. Finally, incentive enhanced the relationship of activation in the visual cortex to visual spatial expectancy and disengagement for both types of incentive (WIN and LOSE). These results show that abstract incentives enhance neural processing within the attention network in a process- and valence-selective manner. They also show that different cognitive and motivational mechanisms may produce a common effect upon unimodal cortices in order to enhance processing to serve the current behavioral goal.
Introduction
Visual spatial attention allows for the rapid isolation of important information from the visual environment to be ‘selected’ for further processing. Shifting the focus of attention from one location to another can be driven via ‘bottom-up’ mechanisms by salient attributes of a particular stimulus, or it can be guided by cognitive processes through ‘top-down’ modulation of sensory cortices (Mesulam, 1999; Nobre, 2001; Corbetta and Shulman, 2002; Pessoa et al., 2003).
There is good evidence that motivational factors can enhance visual spatial attention via ‘bottom-up’ processes. For example, threatening (Easterbrook, 1959; Bradley et al., 1997; Mogg and Bradley, 1999; Ohman et al., 2001) and appetitive (Mogg et al., 1998, 2003) stimuli preferentially capture attention, and this is associated with enhanced activity in the attention and limbic networks (LaBar et al., 2001; Armony and Dolan, 2002). In this case modulation is material-specific in that it is the object's saliency that leads to attentional modulation. Although the mechanism by which these emotionally salient stimuli influence attention is under debate, with some authors arguing that it is an automatic process (Ohman et al., 1995; Vuilleumier et al., 2001) and others arguing that attention is required (Pessoa et al., 2002a,b), most agree that object saliency influences attention in a ‘bottom-up’ manner (Mesulam, 1999; Nobre, 2001; Pessoa et al., 2002). Less is known about the influence of motivation on top-down control of attention and no neuroimaging study has evaluated the neural correlates.
A fundamental goal of top-down influences of spatial attention is to expedite target detection at locations where significant events are expected to occur (Posner et al., 1980). To study this process we previously used a covert attention task in which subjects responded to targets preceded by a spatially valid, invalid or non-informative cue and compared brain activity evoked during trials in which subjects benefited from the presence of a valid directional cue versus trials in which subjects did not benefit from the valid cue (Small et al., 2003). In doing so we were able to isolate activity in the posterior cingulate cortex (PCC) and medial prefrontal cortex that were present only when expectancy was generated to the cued location via top-down biasing. In addition, we observed a linear relationship between the degree of expectancy and activation in this region in half of the subjects; although the effect did not survive a group random effects analysis. Top-down influences upon target selection are also engaged when a target fails to occur at an expected location and attention must be disengaged and redirected to a new location. The inferior parietal lobule, orbitofrontal cortex (OFC) and temporal-parietal junction are thought to mediate disengagement (Nobre et al., 1999; Corbetta and Shulman, 2002).
The goal of the current study was to use monetary incentives and a standard covert attention task (Posner, 1980) to determine the influence of incentive upon the establishment of a visual bias to a cued location and disengagement from an invalidly cued location. Abstract motivational incentives, such as obtaining good grades or winning money, are ideal for evaluating top-down control of attention since they are not object based and any behavioral benefit is likely to be the result of top-down processing. Here we offered subjects monetary incentives for fast responses and hypothesized that such an incentive would benefit performance by decreasing reaction time. Further, we predicted that this would be associated with enhanced activation in regions of the brain mediating top-down attentional control in a process selective manner (e.g. PCC for the generation of attentional bias and inferior parietal lobe during disengagement), or a stronger relationship between activity in these areas and measures of expectancy or disengagement. We also predicted recruitment of regions previously implicated in incentive-behaviors and reward processing (striatum, anterior cingulate, OFC, anterior temporal lobe, insula) (Thut et al., 1997; Knutson et al., 2000, 2001, 2003; Breiter et al., 2001; O'Doherty et al., 2001; Elliott et al., 2003).
Materials and Methods
Subjects
The Institutional Review Board at Northwestern University approved the study protocol. Ten healthy volunteers (7 men and 3 women) with a mean age of 22 years gave written informed consent and participated in two sessions. During the first session, subjects completed the psychophysical task in a laboratory setting and eye movements were recorded. This session was necessary to familiarize subjects with the task and to ensure that they were able to maintain fixation. In the second session subjects completed the task during functional magnetic resonance imaging (fMRI) scanning. All subjects reported being right-handed and all were classified as right-handed by the modified Edinburgh inventory (Oldfield, 1971). The average handedness score was 88 out of a possible 100, with a range of 75–100.
Task
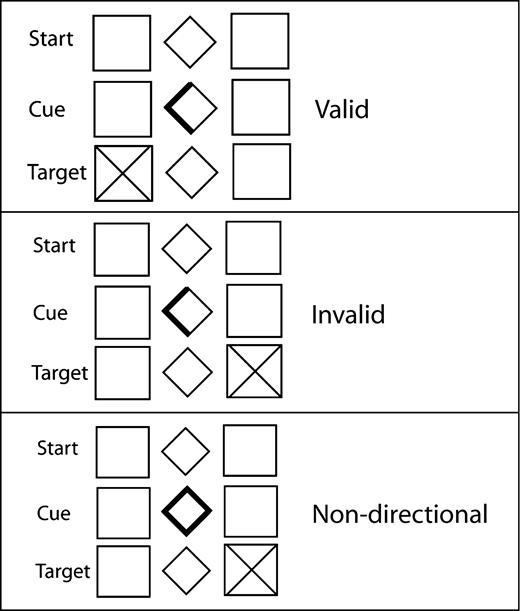
The behavioral task was a modification of the Posner task of covert shifts of spatial attention (Posner, 1980) (Fig. 1). Subjects fixated on a central diamond (1° wide), which remained on the screen throughout the entire task. Subjects were instructed to respond to the onset of peripheral Xs (targets) but not to +s (foils) by pressing a keyboard space bar in the training session or by pushing a nonmagnetic button in the scanner. Targets appeared in one of two peripheral squares (one on the right and one on the left, each 1.5° wide) centered at 7.5° from the central diamond. Targets appeared in 90% of the trials and foils in 10% of trials. Trials began with a brightening of one side or the entire central diamond (100 ms in duration), which provided a directional or non-directional cue, respectively (Fig. 1). Targets appeared on the side indicated by a directional cue (valid trial) 80% of the time or on the opposite side (invalid trial) 20% of the time. [During the non-directional (ND) trial cues the entire central diamond was bolded.] To avoid generation of temporal expectancies we employed three different lengths of delay (or stimulus onset asynchrony, SOA) between cue and target appearance: 200, 400 and 800 ms. Targets and foils appeared for 100 ms with equal frequency on the left or right side of the screen. The inter-trial intervals varied as a function of this delay so that each trial totaled 2 s (i.e. 1800, 1600 and 1200 ms). There were 152 trials per experimental run (138 targets and 14 foils). Of the 152 trials, 53% were valid trials, 13% were invalid trials and 34% were non-directional trials.
Paradigm.
Null events were also included to allow deconvolution of the hemodynamic response function (HRF) (Burock et al., 1998). During null events no cue or target appeared. Null events had the same 2 s duration as stimulus trials, and several could occur in a row. Fifty null events were distributed throughout the run, comprising one-quarter of the trials. Three pseudo-randomized orders of trial presentations were prepared, with the constraint that a maximum of three repetitions of the same trial type was not exceeded. The maximum duration of contiguous null events was 8 s. Each run lasted 7 min and 12.5 s.
Participants performed the task once in a training session in the psychophysics laboratory and once in the fMRI scanner. In both sessions, each run was performed under three different conditions: win money (WIN), lose money (LOSE), or neither win nor lose money — neutral (NEUTRAL). Under each condition subjects were asked to respond as fast as possible to the target. The neutral condition was always run first in the training session so that a cut-off point could be calculated (mean reaction time to ND trials). In the WIN condition, subjects earned 18 cents for each response faster than this cut-off, earning up to $25. During the LOSE condition, subjects were given $25 to start with, and lost 18 cents for each response slower than the cut-off. The order of the incentive condition was counterbalanced across subjects with the exception that the neutral run was always run first in the training session.
Procedures
Psychophysics Laboratory
In the training session subjects sat 40 cm away from a 21 in. monitor. Head movement was minimized by the use of a chin rest. Stimuli were presented by Superlab software running on a Macintosh Computer (Apple, Cupertino, CA). Eye movements were monitored with an ISCAN infrared monitoring system (ISCAN Co., Burlington, MA). These data were only analyzed to make sure the subject could perform the task and are not reported.
fMRI Laboratory
In the scanner subjects viewed images projected onto a nonmagnetic screen located ∼170 cm from their eyes through a mirror that rested on the head coil and was angled for viewing. Head movement was reduced by using a vacuum pillow (VacFix, Toledo, OH). Eye movements were monitored with the Applied Science Laboratories model 504 eye tracking system (ASL, Waltham, MA). The ASL control unit and a 486 PC running the ASL software were located in the MR control room 22.86 m from the eye-camera optical unit (Gitelman, 2002).
Subjects were imaged using a Siemens Vision 1.5 T scanner. Twenty-four contiguous 5 mm slices aligned to the AC–PC line (3 × 3 × 5 mm resolution) were acquired using a susceptibility-weighted single-shot EPI method in order to image the regional distribution of the BOLD signal (TR/TE 2100/40 ms, flip angle 90°, FOV 240, 64 × 64 matrix). In all functional runs, the MR signal was allowed to achieve equilibrium over six initial scans, which were excluded from analysis.
Behavioral Analysis
Eye-movement Data
Eye data were analyzed with the ILAB software (Gitelman, 2002). Eye data were designated as interpretable if the eye was kept ‘online’ at least 90% of the time. Eye movement artifacts related to blinking were filtered out automatically. A region of interest subtending the 3° in each direction from the center defined the fixation zone. Subjects were judged to have maintained fixation if there were fewer than 15 saccades made outside the region of interest within a run.
Psychophysical Data
Each of the 10 subjects performed the task three times, making a total of 30 experimental sessions, 10 for each incentive condition. Trials with reaction times (RTs) shorter than 100 ms or longer than 1000 ms were discarded. The mean RT was calculated for each trial type (ND, valid, invalid) collapsed across SOA for each incentive type. A repeated-measures ANOVA was then performed to evaluate whether RT differed across trial type and across incentive condition. Additionally, we normalized the RTs to the valid, invalid and non-directional trials in WIN and LOSE by subtracting the mean RT to non-directional cue in NEUTRAL. A repeated-measures ANOVA was then performed upon this data.
MR Imaging Data Analysis
fMRI data were analyzed using SPM2 software (Wellcome Department of Cognitive Neurology, London) running under the MATLAB environment (Mathworks, Inc., Sherborn, MA) (Friston et al., 1994; Worsley and Friston, 1995). For each subject functional images were realigned and then coregistered to that subject's anatomic T1 volume. The T1 volume was then normalized to the MNI template supplied with SPM2, which represents an average of 305 subjects and approximately conforms to the space described in the atlas of Talairach and Tournoux (1988). For the individual analyses, functional data were smoothed with a 7 mm isotropic Gaussian kernel. Since there was a considerable degree of variation in the exact location of PCC peaks, a 10 mm isotropic Gaussian kernel was used for smoothing in the group analysis.
To probe for brain activity related to the degree of visual spatial expectancy we correlated CBs associated with each of the valid trials with the BOLD signal evoked during that trial. The regressors for each event type were formed by convolving a delta function of the event onsets (each onset scaled to unity) with a hemodynamic response function (HRF). We used the standard HRF supplied with SPM2, which consists of two gamma functions. This model optimizes detection of peaks within cortical regions. The CBs for individual trials were examined as a parametric interaction with the event-onset regressor. This was performed by entering the CBs for each valid trial and multiplying by the event-onset vector for the valid trials. This had the effect of scaling each event-onset delta function by the CBs. The interaction vector was then convolved with a HRF and included in the design matrix with the convolved event-onset vector. Thus, contrasts on the parametric effect pertained to the CBs and discounted the main effect of the event-onset itself. To determine brain regions in which activity correlated with the degree of disengagement a similar analysis was conducted with the cue cost scores (CCs) and all invalid trials.
We examined the main effects of these correlations with cue benefit and cue cost, and performed one contrast to isolate the effect of incentive: a comparison of the WIN and LOSE correlations to neutral correlation for each subject (WIN + LOSE − NEUTRAL). This contrast does not involve comparing the correlation scores directly but rather contrasting the three parametric regressors in the design matrix. This comparison is equivalent to taking the average of the WIN and LOSE regressors versus the NEUTRAL regressor. Activations were searched for at a mapwise threshold of P = 0.001 uncorrected and a cluster threshold of >3 voxels. Regions were considered significant at a family wise error of P < 0.05 corrected across the volume for unpredicted peaks and P < 0.05 corrected using 15 mm diameter spherical small volume corrections (SVC) for the locations of predicted peaks based upon coordinates obtained in earlier studies. Specifically, we predicted activation in the intraparietal sulcus, dorsolateral prefrontal cortex, thalamus, PCC and anterior cingulate/medial prefrontal cortex to correlate positively with degree of expectancy and used the coordinates from the studies by Kim et al. (1999) and Small et al. (2003) to define the centroid of these ROIs. We predicted activity in the inferior parietal lobule and OFC to correlate with degree of disengagement and used the coordinates from Nobre et al. (1999) to define the centroid. Finally, we predicted stronger relationships and greater activity in the visual cortex, amygdala, insula, and parahippocampal gyrus cingulate (dorsal and subcallosal), OFC and motor cortex associated with the WIN + LOSE > NEUTRAL. Coordinates were used from the work of LaBar et al. (2001) and Small et al. (2001) to define these regions of interest. We also anticipated that increased motivation may enhance the motor response and associated cortical representation and used Talairach coordinates over the hand region to define this volume.
Random-effects analyses were used to assess group effects by calculating the parameter effects images for each subject across trials and then entering these images across subjects into a one-sample t-test (Friston et al., 1999). This involved calculating the within-subject parameter effects image for each contrast of interest. Parameter effects images are the weighted sum of the parameter effects associated with specific columns of the design matrix. This was then performed at each voxel. The weighting of each column is then specified in a contrast vector. The parameter effects images can then be entered into a one-sample t-test to test the null hypothesis that the mean parameter estimate at each voxel across subjects is 0.
Results
Behavioral Data
Eye-movement Data
Analysis of the eye data indicated that subjects had no difficulty maintaining fixation throughout the experiment. On average, 0.9 saccades were made during each run with the mode number of saccades at 0 and the maximum number of saccades during any one run being 7. Of the 4140 trials analyzed (i.e. the sum of valid, invalid and non-directional trials for all subjects), only 15 were contaminated by a saccadic eye-movement (0.4%). Of the 15, seven occurred during valid trials, four during invalid trials and four during non-directional trials. Eight saccades were to the right and seven were to the left hemi-field. Two occurred during WIN, seven during LOSE and four during NEUTRAL.
Behavioral Performance
Only data collected in the scanner are discussed. Accuracy of target detection was >90% in all runs (Table 1). A within-subjects repeated-measures ANOVA indicated that accuracy did not differ across trial [F(2,18) = 0.29; P = 0.75] or incentive types [F(2,18) = 1.75; P = 0.20]. There was one incentive by trial interaction [F(4,36) = 2.4; P = 0.06]; within ND trials, accuracy was greater in LOSE than NEUTRAL (P = 0.032).
Accuracy data (%) from performance of the covert attention task in the scanner
| Valid | Invalid | ND | Total | |
|---|---|---|---|---|
| Win | 97.6 (3.5) | 96.1 (5.8) | 98.3 (3.3) | 97.4 (1.3) |
| Lose | 98.3 (2.3) | 96.7 (4.7) | 99.4 (1.0) | 97.4 (1.2) |
| Neutral | 97.2 (4.3) | 97.8 (5.4) | 97.1 (2.9) | 98.1 (0.7) |
| Total | 97.7 (2.9) | 96.8 (4.2) | 98.3 (1.9) |
| Valid | Invalid | ND | Total | |
|---|---|---|---|---|
| Win | 97.6 (3.5) | 96.1 (5.8) | 98.3 (3.3) | 97.4 (1.3) |
| Lose | 98.3 (2.3) | 96.7 (4.7) | 99.4 (1.0) | 97.4 (1.2) |
| Neutral | 97.2 (4.3) | 97.8 (5.4) | 97.1 (2.9) | 98.1 (0.7) |
| Total | 97.7 (2.9) | 96.8 (4.2) | 98.3 (1.9) |
Mean accuracy score and standard deviation (in parenthesis) for all trial and condition types.
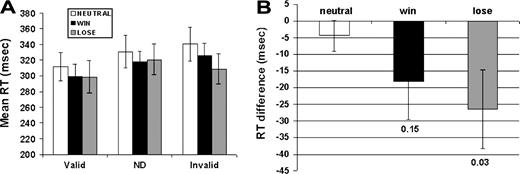
The mean reaction time for each trial type (valid, invalid and ND) and each condition (WIN, LOSE and NEUTRAL) were analyzed using a repeated-measures ANOVA with planned comparisons. There was a main effect of trial type [F(1,9) = 20.2; P = 0.001], showing that the valid trials were associated with the fastest reaction times (P = 0.001 compared to ND and invalid trials). There was also a main effect of incentive [F(1,9) = 3.3; P = 0.05], such that overall reaction time was faster for the LOSE compared to NEUTRAL condition (P = 0.05) with a trend towards the reaction time for trials in the WIN condition also being faster than NEUTRAL (P = 0.15). There were no differences between WIN and LOSE (P = 0.67). A trial by condition (WIN, LOSE and NEUTRAL) interaction was also marginally present [F(1,9) = 2.9; P = 0.06] (Fig. 2A). Planned comparisons indicated that there were no significant differences in reaction times between trials for WIN versus LOSE for any of the trial types (valid P = 0.32, invalid P = 0.39, ND 0.18). There were also no differences in reaction times for the non-directional trials across any of the incentive conditions (WIN versus NEUTRAL, P = 0.23; LOSE versus NEUTRAL, P = 0.42). In contrast, valid trials showed a trend to being faster in the WIN compared to the NEUTRAL condition (mean valid RT for WIN = 299/ SE =14; NEUTRAL = 311/ SE = 20; P = 0.15), while invalid trials were faster in the LOSE compared to the NEUTRAL condition (mean invalid RT for LOSE = 309/SE = 19; NEUTRAL = 340/SE = 21; P = 0.02). Thus monetary incentives did not increase the differences in reaction time between responses to valid and invalid cues. Instead, there was an interaction between condition and trial type such that monetary rewards only produced an effect upon directionally cued trials (valid and invalid but not ND).
(A) Mean reaction time (RT) for each trial in each condition. ND = non-directional trials. (B) Mean difference in RT to non-directional cues in the NEUTRAL condition compared to the averaged RT to valid and invalid cues in NEUTRAL, WIN and LOSE. Error bars represent the standard error of the mean.
We also evaluated the effect of incentive by normalizing RT in valid and invalid trials by taking the difference in RT between the non-directional trials in the NEUTRAL run and the valid and invalid trials in NEUTRAL, WIN and LOSE. RT differences were then entered into an ANOVA, which revealed a main effect of incentive [F(1,9) = 4.6; P = 0.03] and a trend towards an interaction between incentive and trial type [F(1,9) = 2.8; P = 0.06]. As in the previous analysis the main effect was mostly due to faster responses during LOSE compared to NEUTRAL (P < 0.03), with a trend observed for WIN compared to NEUTRAL (P < 0.15) (Fig. 2B). Taken together, the results show that monetary incentives can selectively enhance visual spatial attention during conditions in which top-down attentional mechanisms are important for improving performance; however, the effect is small.
A repeated-measures ANOVA indicated that there was no significant difference [F(1,9) = 1.3; P = 0.28] between the number of responses that were faster than the cut-off (mean RT during performance in cognitive laboratory) across all trial types in WIN (mean = 99.4 trials), NEUTRAL (mean = 94.4) or LOSE (mean = 97). However, when the analysis was restricted to invalid and valid trials, there was a trend [F(1,19) = 2.5; P = 0.15] to have fewer slow responses in the WIN (P = 0.06) and LOSE runs (P = 0.07) compared to NEUTRAL. A paired t-test showed no significant difference [t(1,9) = 0.31; P = 0.74] between the amount of money earned during WIN and LOSE conditions with subjects earning an average of $17.90 in WIN condition and $17.46 in the LOSE condition.
fMRI Data
The primary goal of this study was to determine if monetary incentives affect processing within brain regions that underlie two forms of top-down attentional control: visual spatial expectancy and disengagement.
Visual Spatial Expectancy
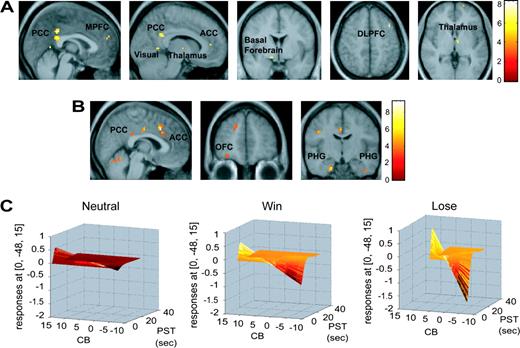
To determine the main effect of the generation of a visual spatial bias towards a cued location, the CBs was regressed against the BOLD signal for all conditions (WIN, LOSE, and NEUTRAL) across the entire brain (Table 2). Activity in the PCC and medial prefrontal cortex was positively correlated with the degree of benefit derived from the valid cue (CBs) (Fig. 3A). Additional correlations were observed in the dorsolateral prefrontal cortex, visual cortex, thalamus, and basal forebrain (Table 2A). We note that the smoothing we used does not allow us to draw conclusions about the precise anatomical loci of the activations within the thalamus and basal forebrain.
Visual spatial expectancy. (A) Images from the group random effects analysis of the regression of cue benefit score across the whole brain in all three conditions (WIN, LOSE and NEUTRAL). Peaks labeled are reported in Table 2. The images are thresholded at P < 0.001 uncorrected. Top sagittal sections showing activity in the anterior and posterior cingulate cortex (ACC and PCC), medial prefrontal cortex (MPFC), visual cortex (Vis) and thalamus (Thal); coronal section below displays basal forebrain (BF) activity and axial sections show dorsolateral prefrontal cortex activity (DLPFC); and thalamic peak. Color bars represent t-values. (B) Images from the group random effects analysis showing regions with a greater relationship to the cue benefit score in the WIN and LOSE conditions compared to the neutral condition. The images are thresholded at P < 0.005. From left to right: saggital section showing enhanced activation in the cingulate cortex, coronal section showing orbitofrontal cortex (OFC) activity and coronal section displaying bilateral parahippocampal gyrus (PHG) peaks. The color bar represents t-values. (C) Graphs of the cue benefit score (CB) (z-axis; scale ranging from −10 to 10), plotted against fMRI signal in the same region of the posterior cingulate cortex (y axis; scale ranging from 1 to −2) as a function of peristimulus time (PST) (x-axis; scale ranging from 0 to 40 s) in the three conditions (WIN, LOSE and NEUTRAL) in a representative subject. The color-coding is added only to facilitate viewing depth.
Visual spatial expectancy
| Region and regression condition | x (mm) | y (mm) | z (mm) | Z-score | P-value | |||||
|---|---|---|---|---|---|---|---|---|---|---|
| (A) Main effect of CBs: regression of CBs versus BOLD from valid trials in all conditions (RPC) | ||||||||||
| Thalamus | 6 | −9 | 0 | 3.9 | 0.0004 | |||||
| Basal forebrain | −15 | 0 | −12 | 3.9 | 0.0005 | |||||
| Posterior cingulate cortex | 0 | −42 | 33 | 4.3 | 0.0002 | |||||
| 3 | −42 | 21 | 4.2 | 0.0003 | ||||||
| 9 | −48 | 24 | 4.0 | 0.001 | ||||||
| 3 | −57 | 33 | 3.6 | 0.003 | ||||||
| Anterior cingulate/medial prefrontal cortex | 9 | 42 | 9 | 3.6 | 0.003 | |||||
| 0 | 54 | 24 | 3.3 | 0.009 | ||||||
| Visual cortex | 0 | −54 | 6 | 3.9 | 0.001 | |||||
| Dorsolateral prefrontal cortex | 39 | 12 | 51 | 4.3 | 0.0001 | |||||
| (B) CBs regression: WIN − NEUTRAL | ||||||||||
| Posterior cingulate cortex | 21 | −39 | 36 | 3.5 | 0.004 | |||||
| Anterior cingulate cortex | 9 | 30 | 30 | 3.6 | 0.003 | |||||
| Parahippocampal gyrus | −24 | −9 | −33 | 3.3 | 0.008 | |||||
| 33 | −15 | −21 | 3.3 | 0.009 | ||||||
| Orbitofrontal cortex | −18 | 42 | −9 | 3.3 | 0.009 | |||||
| Visual cortex | −30 | −87 | 27 | 4.8 | 0.05a | |||||
| Intraparietal sulcus | −48 | −57 | 42 | 3.3 | 0.01 | |||||
| (C) CBs regression: LOSE − NEUTRAL | ||||||||||
| Thalamus | −18 | −6 | 3 | 34.0 | 0.001 | |||||
| Posterior cingulate cortex | 9 | −27 | 45 | 3.6 | 0.003 | |||||
| Anterior cingulate cortex | 0 | 15 | 39 | 3.9 | 0.001 | |||||
| Parahippocampal gyrus | 27 | −24 | −21 | 4.4 | 0.0001 | |||||
| −21 | −12 | −33 | 4.2 | 0.0002 | ||||||
| (D) CBs regression: WIN + LOSE − NEUTRAL | ||||||||||
| Thalamus | −18 | −3 | 6 | 3.3 | 0.009 | |||||
| Posterior cingulate cortex | −3 | −12 | 36 | 3.5 | 0.004 | |||||
| 9 | −27 | 45 | 3.2 | 0.01* | ||||||
| −6 | −36 | 27 | 3.0 | 0.03* | ||||||
| 15 | −36 | 42 | 2.9 | 0.04* | ||||||
| Anterior cingulate cortex | −3 | 18 | 36 | 4.5 | 0.00006 | |||||
| Parahippocampal gyrus | −21 | −12 | −3 | 3.9 | 0.001 | |||||
| 45 | −9 | −36 | 3.7 | 0.002 | ||||||
| Orbitofrontal cortex | −27 | 60 | −18 | 3.4 | 0.006 | |||||
| Visual cortex (area 19) | −27 | −81 | 24 | 3.4 | 0.007 | |||||
| Ventrolateral prefrontal cortex | −51 | 3 | 27 | 4.2 | 0.0002 | |||||
| (E) CBs Regression: WIN − LOSE | ||||||||||
| Subcallosum | 9 | 33 | −3 | 4.3 | 0.0002 | |||||
| Orbitofrontal cortex | −15 | 24 | −12 | 3.6 | 0.002 | |||||
| −24 | 30 | −12 | 3.4 | 0.006 | ||||||
| −21 | 45 | −15 | 4.2 | 0.0003 | ||||||
| (F) CBs Regression: LOSE − WIN | ||||||||||
| Thalamus | −9 | −21 | 15 | 4.2 | 0.0003 | |||||
| Insula | −39 | −15 | 15 | 3.9 | 0.001 | |||||
| 42 | 42 | −21 | 6 | 3.7 | 0.001 | |||||
| Anterior cingulate cortex | 0 | 27 | 27 | 3.9 | 0.001 | |||||
| Visual cortex (area 18) | −12 | −66 | 12 | 3.8 | 0.002 | |||||
| 0 | −60 | 6 | 3.8 | 0.002 | ||||||
| (G) CBs regression: conjunction WIN and LOSE | ||||||||||
| Anterior cingulate cortex | 12 | 42 | 9 | 3.7 | 0.002 | |||||
| Posterior cingulate cortex | 3 | −12 | 33 | 3.6 | 0.004 | |||||
| 0 | −42 | 33 | 3.1 | 0.007 | ||||||
| Visual cortex (area 19/18) | −30 | −87 | 30 | 3.7 | 0.003 | |||||
| 18 | −60 | 3 | 3.1 | 0.02 | ||||||
Corrected across the entire brain;
present only when threshold dropped to 0.005.
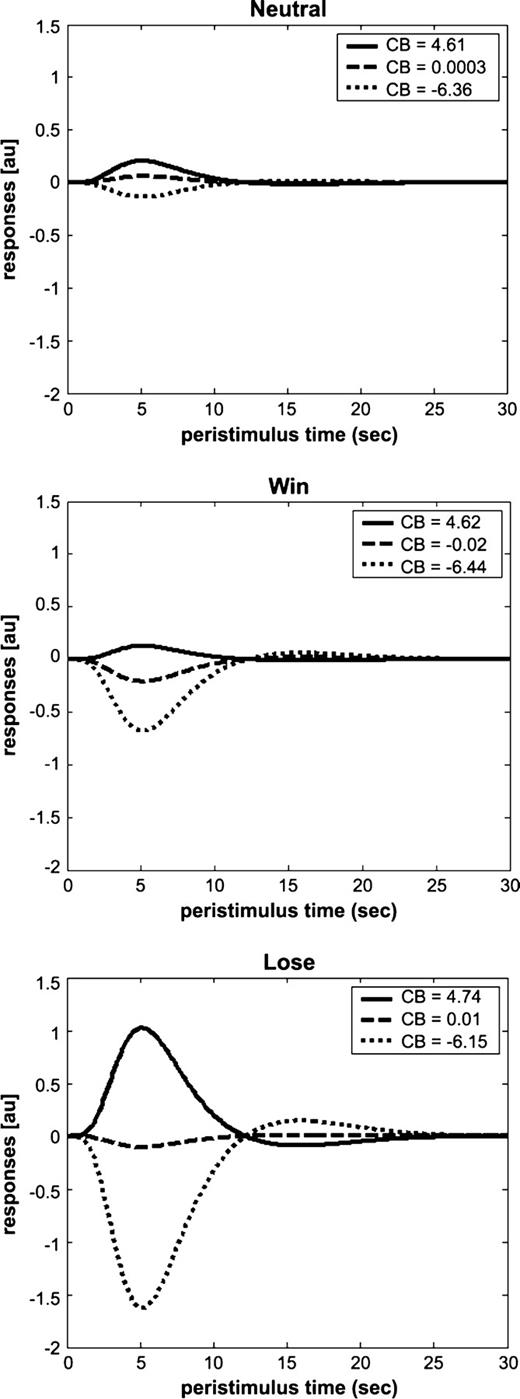
The regressions were then contrasted across conditions to evaluate the effect of monetary incentive upon the strength of the relationship between visual spatial expectancy and activation in the PCC. A stronger relationship was observed in this region in WIN compared to NEUTRAL (Table 2B), LOSE compared to NEUTRAL (Table 2C), WIN + LOSE compared to NEUTRAL (Table 2D and Fig. 3B) and in a conjunction analysis designed to highlight common areas of activation in WIN and LOSE (Table 2G). Figure 3C depicts the relationship between cue benefit score and response within the PCC under each incentive condition in a single location in a representative subject. Figure 4 displays the average response in the PCC at three levels of CBs under each of the three conditions (WIN, LOSE, NEUTRAL).
Fitted response in the posterior cingulate cortex at three levels of cue benefit. Graphs show the response in the posterior cingulate cortex (PCC) at three levels of cue benefit (CB) score for the NEUTRAL (top), WIN (middle) and LOSE (bottom) conditions in a representative subject. y-axis = response in arbitrary units (au). x-axis = peristimulus time in s. The degree to which the response varies as a function of CB score depends upon the incentive condition.
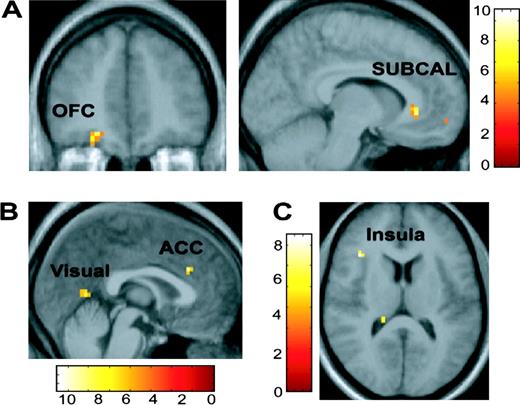
Incentives [(WIN + LOSE) − NEUTRAL] were also associated with additional limbic system recruitment including the OFC, anterior cingulate cortex, and parahippocampal cortex (Table 2D and Fig. 3B). Direct comparison of WIN and LOSE indicated that the OFC was preferentially associated with the possibility of winning money (Table 2E and Fig. 6A) while the dorsal anterior cingulate cortex was preferentially associated with the possibility of losing money (Table 2F and Fig. 6B). In addition, WIN − LOSE showed activation in the subcallosal area while the reverse contrast produced activation in the insula. None of these areas were observed in the main analysis and thus are recruited for visual spatial biasing only during the presence of a monetary incentive.
A stronger relationship with CBs was also consistently observed in the visual cortices during the monetary incentive compared to the neutral conditions. This was true for both WIN and LOSE but appeared to be somewhat stronger for LOSE (Table 2B,C,F).
Visual Spatial Disengagement
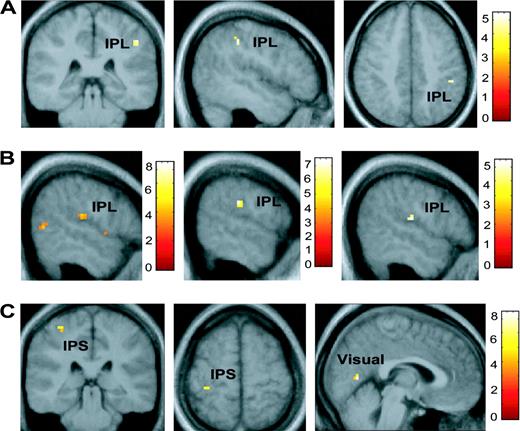
To determine the main effect of spatial disengagement following invalid cueing, the CCs were regressed against the BOLD signal for all incentive conditions across the entire brain (Table 3A). This analysis isolated activation in the right inferior parietal lobule, which was positively correlated with the amount of cue cost produced by the invalid cue (Fig. 5A). No other regions of the brain were correlated with the degree of cue cost.
Visual spatial disengagement. (A) Images showing the inferior parietal lobule (IPL) regression with the cue cost score (disengagement) collapsed across all three conditions (WIN, LOSE and NEUTRAL) in the group random effects analysis thresholded at P < 0.001. (B) From left to right, regression CCs with BOLD signal showing activations in the inferior parietal lobule in WIN + LOSE − NEUTRAL (thresholded at P < 0.005), WIN − NEUTRAL (threshold at P = 0.001), and LOSE − NEUTRAL (threshold at P < 0.001) conditions. (C) Activation in the intraparietal sulcus (IPS), and visual cortex in WIN + LOSE − NEUTRAL. Color bars represent t-values.
Disengagement
| Region and regression condition | x (mm) | y (mm) | z (mm) | Z-score | P-value | |||||
|---|---|---|---|---|---|---|---|---|---|---|
| (A) Regression of CCs against BOLD for invalidly cued trials in all conditions | ||||||||||
| Inferior parietal lobule | 48 | −36 | 42 | 3.5 | 0.003 | |||||
| Orbitofrontal cortex | −18 | 42 | −21 | 2.6 | 0.04* | |||||
| (B) Regression of CCs: WIN − NEUTRAL | ||||||||||
| Inferior parietal lobule | 63 | −27 | 27 | 4.1 | 0.0003 | |||||
| Visual cortex (area 18) | 3 | −63 | 6 | 3.9 | 0.001 | |||||
| (C) Regression of CCs: LOSE − NEUTRAL | ||||||||||
| Inferior parietal lobule | 54 | −21 | 15 | 3.6 | 0.003 | |||||
| Visual cortex (area 18) | 0 | −66 | 9 | 3.2 | 0.02 | |||||
| (D) Regression of CCs: WIN + LOSE − NEUTRAL | ||||||||||
| Visual cortex (area 18) | −3 | −66 | 6 | 4.3 | 0.0002 | |||||
| Intraparietal sulcus | −36 | −33 | 60 | 3.8 | 0.002 | |||||
| Inferior parietal lobule | 51 | −27 | 18 | 3.3 | 0.04* | |||||
| (E) Regression of CCs WIN − LOSE | NS | NS | NS | NS | NS | |||||
| (F) Regression of CCs LOSE − WIN | ||||||||||
| Insula | −39 | 24 | 12 | 4.0 | 0.001 | |||||
| 30 | 15 | 3 | 3.4 | 0.007 | ||||||
| (G) Regression of CCs: conjunction WIN and LOSE | ||||||||||
| Intraparietal sulcus | −36 | −51 | 57 | 3.5 | 0.005 | |||||
| Intraparietal sulcus/inferior parietal lobule | −48 | −30 | 51 | 3.7 | 0.002 | |||||
| Visual cortex (area 18) | 15 | −66 | 12 | 3.2 | 0.02 | |||||
Present only when threshold dropped to 0.005.
Comparison of the regressions between conditions showed that activation in a similar or slightly more inferior region of the inferior parietal cortex was greater in WIN compared to NEUTRAL, LOSE compared to NEUTRAL, WIN + LOSE compared to NEUTRAL, and in a conjunction analysis designed to highlight areas common to winning and losing money during disengagement (Table 3B,C,D,G and Fig. 5B). Activation in the intraparietal sulcus was also observed in WIN + LOSE compared to NEUTRAL and in the conjunction analysis (Table 3D,G), and there was a stronger relationship between disengagement and BOLD signal in the visual cortex in WIN compared to NEUTRAL, LOSE compared to NEUTRAL, and WIN + LOSE compared to NEUTRAL (Table 3B,C,D and Fig. 5C).
Direct comparison between the incentive conditions (WIN versus LOSE) revealed that the relationship between disengagement and the BOLD signal was greater in the insular cortex in LOSE compared to WIN (Table 3F and Fig. 6B). No other differences between incentive conditions were observed.
Valence-specific attentional modulatory effects. (A) From left to right: coronal and sagittal images depict activation in the orbitofrontal cortex (OFC) and subcallosal region (SUBCAL) preferentially associated with degree of visual bias (indexed by the comparison of the regression of WIN > LOSE with the cue benefit score -CBs) during the possibility of winning compared to losing money. (B) Sagittal section showing activation in the dorsal anterior cingulate cortex and visual cortex preferentially associated with degree of visual bias (indexed by the comparison of the regression of LOSE > WIN with the CBs) during the possibility of losing compared to wining money. (C) Axial section showing activity in the insula preferentially associated with the degree of disengagement (as indexed by a comparison of the regression of LOSE > WIN with the cue cost score CCs). All images thresholded at P < 0.001. Color bars represent t-values.
Comparison with Non-directional Trials
In order to confirm that the PCC plays a specific role in visual spatial expectancy and the inferior parietal cortex plays a specific role in disengagement we wanted to compare activation in the valid trials (visual spatial expectancy) and invalid (disengagement) trials with activation evoked in response to the non-directional trials. We could not compare regressions of performance across the three trial types for several reasons. First, a cue cost/benefit score cannot be calculated for non-directional trials. Second, fast reaction times (RTs) are likely to occur whenever attention is focused at the location where the target eventually occurs, and hence should be related to a visual spatial bias irrespective of trial type. For example, although most non-directional trials have slower RTs than valid trials, a few have RTs that are just as fast. These fast non-directional trials are likely caused by the subject correctly anticipating the side of the target's appearance (i.e. establishing visual spatial expectancy). Therefore a regression of RT with BOLD signal in the non-directional trials will also isolate visual spatial expectancy. A similar argument can be made for disengagement, since some non-directional trials will undoubtedly be characterized by incorrect focalization and disengagement and these trials will have the slowest RTs. Instead we compared mean brain activity associated with each of the trial types (no regression) by performing group random effects analyses for the contrast valid–non-directional and invalid–non-directional. Visual spatial expectancy should be established on most valid trials, disengagement on most invalid trials and neither on most non-directional trials. Directed searches were performed for clusters within a 20 mm radius search volume surrounding the peaks in the PCC and inferior parietal cortex identified in the regression analyses described above. As predicted, and in accordance with our previous study (Small et al., 2003), greater activity within the PCC was observed in valid compared to non-directional trials (6, −24, 39; z = 3.4). In addition, several peaks were isolated in the inferior parietal lobule in the comparison of the invalid to the non-directional trials (39, −30, 51; z = 3.7; 63, −36, 36; z = 3.1; 36, −51, 39; z = 3.1).
Discussion
We investigated the effect of monetary incentives upon two processes of top-down attentional control: visual spatial expectancy and disengagement. We found that motivational incentives recruited novel limbic regions and enhanced processing in the PCC but not the inferior parietal lobule during the establishment of an anticipatory visual spatial bias, and in the inferior parietal lobule but not the PCC during disengagement. In addition, we provide preliminary evidence to suggest that monetary rewards and penalties may influence the attention network via dissociable limbic mechanisms. Specifically, medial orbitofrontal activity was preferentially engaged when subjects had the possibility of winning money and the dorsal anterior cingulate cortex and insula were preferentially engaged when there was a possibility of losing money. Finally, our results show enhancement of processing in the early visual cortical regions irrespective of type of top-down process being engaged or valence of motivational incentive.
Interaction of Motivation and Visual Spatial Expectancy
In a previous study we showed that there is greater activation in the PCC and medial prefrontal cortex during validly cued trials that benefit performance compared to validly cued trials that do not. Since greater benefit of the valid cue is likely due to an enhanced bias towards the cued location, we interpreted this finding as suggesting a role for the PCC in the generation of visual spatial biases (Small et al., 2003). However, in that study we did not observe a consistent relationship between degree of bias and activation of the PCC. In the current study, although the behavioral effect produced by monetary incentives was modest (Fig. 2), the presence of the incentive had a clear effect upon the relationship between the anticipatory bias and activation in the PCC in that degree of bias was consistently associated with greater activation. This was not true for the medial prefrontal cortex (Figs. 3 and 4). These findings are consistent with data from Hopfinger and colleagues showing that the PCC is more sensitive to the appearance of cues than targets (Hopfinger et al., 2000) and with single-cell recording studies in monkeys showing that posterior cingulate neurons signal the expected and actual reward outcome associated with shifts of gaze (McCoy et al., 2003). Taken in conjunction with the known connectivity of the cingulate region with regions of the brain involved in attention and motivational processing (Mesulam et al., 1977; Pandya et al., 1981; Morecraft et al., 1992), we propose that the PCC serves as a neural interface between emotion and top-down control of attention. One important caveat, given our current design, is that any changes between the incentive and control conditions may reflect not only motivation but also its correlates of increased arousal or effort. Future studies will be important to disentangle these effects.
In addition to enhancing activity in the PCC, monetary incentives recruited additional limbic regions including the OFC, anterior cingulate cortex and parahippocampal gyrus. It appears, therefore, that the top-down effect of incentive upon anticipatory biasing may be mediated through the influence of these areas upon the PCC. All three of these regions are sensitive to food reward (Small et al., 2001) and the OFC is consistently activated by monetary rewards (Thut et al., 1997; Breiter et al., 2001; Knutson et al., 2001; Elliott et al., 2003; Knutson et al., 2003; O'Doherty et al., 2003). Neuroanatomical experiments in the rhesus monkey have revealed prominent monosynaptic connections between the posterior cingulate and the OFC, anterior cingulate cortex and parahippocampal region (Pandya et al., 1981; Morris et al., 2000). Analogous connections may exist in the human brain and may mediate the functional interactions that were observed here.
The possibility of winning or losing money produced similar enhancement of processing in the PCC during the establishment of visual spatial biases; however, it appears that they produce these effects via dissociable mechanisms. The possibility of winning money preferentially engaged the OFC, while the possibility of losing money preferentially engaged the dorsal anterior cingulate cortex. This finding suggests that there may be multiple routes by which motivational factors can produce similar influences upon attentional allocation and that one important factor in determining route of influence may be valence. Another possible interpretation is that subjects took different strategies during WIN and LOSE and that this, not the reward value, leads to differential engagement of the limbic system rather than the reward value. For example, the region of ACC recruited preferentially during LOSE corresponds to the area implicated in error detection (Falkenstein et al., 1991; Gehring et al., 1993; Gehring and Fencsik, 2001) and in monitoring competition between processes that conflict during task performance (Carter et al., 1998; Botvinick et al., 1999; Carter et al., 1999). This may indicate that the prospect of losing money caused subjects to perceive that they were making more errors in LOSE versus WIN and NEUTRAL and this, in turn, motivated them to perform better.
The OFC has been previously implicated in the modulation of attention by threatening stimuli (Armony and Dolan, 2002). In one study, Armony and Dolan presented conditioned and unconditioned fearful faces immediately prior to the onset of a target. Orbitofrontal activation was observed when attention was influenced by the aversively conditioned fearful face (the unconditioned stimulus was a loud burst of noise) (Armony and Dolan, 2002). However, the region of OFC that they observed was slightly more lateral than the peak we report. This discrepancy in the location of OFC activity is in accordance with data illustrating discretely localized valence-specific activations to primary rewards (Small et al., 2001, 2003; Gottfried et al., 2002; Anderson et al., 2003) as well as monetary rewards (Breiter et al., 2001; O'Doherty et al., 2001; Elliott et al., 2003), and some indication that, depending upon the reward context (recent history of reward and punishment), the lateral portion may be preferentially recruited by punishment or suppression of previously rewarded responses and the medial region by positive reward contingencies (Elliott et al., 2000a,b, 2003; O'Doherty et al., 2001; Small et al., 2001; Gottfried et al., 2002). In addition, both the OFC and PCC are thought to track the reward value of behavioral outcomes (Tremblay and Schultz, 1999, 2000; Knutson et al., 2001; McCoy et al., 2003) and together may play a critical role in guiding attention to rewarding objects and events.
Interaction of Motivation and Visual Spatial Disengagement
Top-down influences upon target selection are also engaged when a target fails to occur at an expected location and attention must be disengaged and redirected to a new location. Here we observed a significant relationship between activation in the inferior parietal lobule and the amount of cue cost due to disengagement produced by a misleading directional cue (Fig. 5A). The relationship between disengagement and fMRI signal was enhanced by monetary incentives in an adjacent but slightly more inferior region of the inferior parietal lobule (Fig. 5B). Interestingly, the monetary incentives lead to a reduction in the cost associated with the misleading cue (Fig. 2). This finding, which is in accordance with previous behavioral observations (Stormark et al., 1999), suggests that increased motivation may lead to increased effort to disengage, and that this effort is in turn associated with greater recruitment of the inferior parietal lobule.
Damage to the inferior parietal lobule has been consistently associated with the clinical syndrome of hemi-spatial neglect (Mesulam, 1981), in which patients fail to attend and respond to objects in the left visual field. Previous neuroimaging studies have also shown activation in this region associated with invalid compared to valid directional cueing (Nobre et al., 1999; Corbetta et al., 2000). The current results corroborate and extend these findings by demonstrating a linear relationship between the degree to which invalid directional cues increase the cost of performance (i.e. disengagement) and activation within the inferior parietal lobule. It has been suggested that the relationship between the inferior parietal lobule and disengagement provides evidence that the region is critical for stimulus-driven control of selection (Corbetta and Shulman, 2002). Our results argue against this notion since monetary rewards enhanced the relationship and are more likely to enhance top-down control of selection than stimulus-driven selection. In addition to the inferior parietal lobule, disengagement was also correlated with activity in the intraparietal sulcus and visual cortex.
In contrast to visual spatial expectancy, disengagement during WIN did not recruit orbitofrontal activity. However, the OFC is activated during disengagement even without the presence of an abstract incentive (Nobre et al., 1999). Therefore, it is possible that the OFC is recruited during disengagement irrespective of the presence of type of motivational incentive and may thus serve a more fundamental role in this attentional process. In partial support of this hypothesis, we observed a small activation within this region (−18, 42, −21; z = 2.7; P = 0.04 SVC) when the t-map threshold was dropped to P < 0.005 in the analysis of the main effect of disengagement (Table 2A).
Motivational Enhancement in the Visual Cortex Irrespective of Type of Top-down Processing
The visual cortical areas were the only regions of the brain to show increased relationship with top-down processing irrespective of the type of process engaged (expectancy versus disengagement) or valence of motivational influence. Activity along the medial wall of striate/prestriate cortex (perhaps corresponding to BA areas 17 and 18) correlated with disengagement and expectancy, whereas activity in a more posterior lateral section of prestriate cortex (perhaps corresponding to area 19) was associated only with degree of expectancy. This suggests that top-down modulation of sensory cortex may involve common mechanisms across specific attentive processes (e.g. disengagement versus expectancy, local versus focal or spatial versus object) (Shulman et al., 1997) as well as more refined mechanisms that are process-specific (Giesbrecht et al., 2003). These findings are also consistent with the hypothesis that the influence of attention upon behavior is orchestrated predominantly by heteromodal regions of the brain rather than by lower-order cortex such as unimodal primary or association areas (Mesulam, 1981).
Summary
Previous studies examining the neural interaction of emotion and attention have focused upon the ability of salient emotional stimuli to capture attention (LaBar et al., 2001; Mogg and Bradley, 1999; Vuilleumier et al., 2001; Armony and Dolan, 2002; Pessoa et al., 2002a,b). This type of interaction is based upon the features of the attended object and probably involves bottom-up influences of motivation upon attention. In the current study we sought to uncover the ability of abstract incentives to influence one example of top-down attentional control. We demonstrate, for the first time, that abstract incentives can influence top-down control of visual spatial attention by recruiting additional limbic regions and modulating neural processing within the regions associated with this attentional control. Moreover, we were also able to show that while abstract incentives enhance neural processing within the attention network in a process- and valence-selective manner, these different cognitive and motivational mechanisms may produce a common effect upon unimodal cortices in order to enhance processing to serve the current behavioral goal.
We would like to thank Erica Mak and Kensen Lam for their assistance in this study. This work was supported by Northwestern Alzheimer's Disease Center (grant PHSAG13854 awarded to D.M.S., NIA (grant K23AG00940-04 awarded to D.R.G., and NINDS (grant NS30863–03) awarded to M.-M.M.
References
Anderson AK, Christoff K, Stappen I, Panitz D, Ghahremani DG, Glover G, Gabrieli JDE, Sobel N (
Armony JL, Dolan RJ (
Botvinick M, Nystrom LE, Fissell K, Carter CS, Cohen JD (
Bradley BP, Mogg K, Millar N, Bonham-Carter C et al. (
Breiter HC, Aharon I, Kahneman D, Dale A, Shizgal P (
Burock MA, Buckner RL, Woldorff MG, Rosen BR, Dale AM (
Carter CS, Braver TS, Barch DM, Botvinick M, Noll D, Cohen JD (
Carter CS, Botvinick MM, Cohen JD (
Corbetta M, Shulman GL (
Corbetta M, Kincade JM, Ollinger JM, McAvoy MP, Shulman GL (
Easterbrook JA (
Elliott R, Dolan RJ, Frith CD (
Elliott R, Friston KJ, Dolan RJ (
Elliott R, Newman JL, Longe OA, Deakin JF (
Falkenstein M, Hohnsbein J, Hoormann J, Blanke L (
Friston KJ, Tononi G, Reeke GN, Sporns O, Edelman GM (
Gehring WJ, Fencsik DE (
Gehring WJ, Gross B, Coles MGH, Meyer DE, Donshin E (
Giesbrecht B, Woldorff MG, Song AW, Mangun GR (
Gitelman DR (
Gottfried JA, O'Doherty J, Dolan RJ (
Hopfinger JB, Buonocore MH, Mangun GR (
Kim YH, Gitelman DR, Nobre AC, Parrish TB, LaBar KS, Mesulam MM (
Knutson B, Westdorp A, Kaiser E, Hommer D (
Knutson B, Fong GW, Adams CM, Varner JL, Hommer D (
Knutson B, Fong GW, Bennett SM, Adams CM, Hommer D (
LaBar KS, Gitelman DR, Parrish TB, Kim YH, Nobre AC, Mesulam MM (
McCoy AN, Crowley JC, Haghighian G, Dean HL, Platt ML (
Mesulam MM (
Mesulam MM (
Mesulam MM, Van Hoesen GW, Pandya DN, Geschwind N (
Mogg K, Bradley BP (
Mogg K, Brendan BP, Hyare H, Lee S (
Mogg K, Bradley BP, Field M, De Houwer J (
Morecraft RJ, Geula C, Mesulam MM (
Morris R, Paxinos G, Petrides M (
Nobre AC (
Nobre AC, Coull JT, Frith CD, Mesulam MM (
O'Doherty J, Kringelbach ML, Rolls ET, Hornak J, Andrews C (
O'Doherty J, Critchley H, Deichmann R, Dolan RJ (
Ohman A, Esteves F, Soares JJF (
Ohman A, Flykt A, Esteves F (
Oldfield RC (
Pandya DN, Van Hoesen GW, Mesulam M-M (
Pessoa L, Kastner S, Ungerleider LG (
Pessoa L, McKenna M, Gutierrez E, Ungerleider LG (200b) Neural processing of emotional faces requires attention.
Pessoa L, Kastner S, Ungerleider LG (
Posner MI, Snyder CR, Davidson BJ (
Shulman GL, Corbetta M, Buckner RL, Raichle ME, Fiez JA, Miezin FM, Petersen SE (
Small DM, Zatorre RJ, Dagher A, Evans AC, Jones-Gotman M (
Small DM, Zatorre RJ, Dagher A, Evans AC, Jones-Gotman M (
Small DM, Gitelman DR, Gregory MD, Nobre AC, Parrish TB, Mesulam M-M (
Small DM, Gregory MD, Mak YE, Gitelman DR, Mesulam MM, Parrish TB (
Stormark KM, Hugdahl K, Posner MI (
Thut G, Schultz W, Roelcke U, Nienhusmeier M, Missimer J, Maguire RP, Leenders KL (
Tremblay L, Schultz W (
Tremblay L, Schultz W (
Vuilleumier P, Armony JL, Driver J, Dolan RJ (
Author notes
1Northwestern University Brain Mapping Group and Cognitive Neurology and Alzheimer's Disease Center, 2Department of Neurology, 3Department of Psychology and 4Department of Radiology, Northwestern University Medical School, 320 East Superior Street, Searle 11, Chicago, IL 60611, USA, 5Department of Psychology, Yale University, 2 Hillhouse Avenue, New Haven, CT 06520, USA, 6Department of Surgery, Yale University, 333 Cedar Avenue, New Haven, CT 06520, USA and 7The John B. Pierce Laboratory, 290 Congress Avenue, New Haven, CT 06519, USA