


Abstract
Normal aging and chronic alcoholism result in disruption of brain white matter microstructure that does not typically cause complete lesions but may underlie degradation of functions requiring interhemispheric information transfer. We examined whether the microstructural integrity of the corpus callosum assessed with diffusion tensor imaging (DTI) would relate to interhemispheric processing speed. DTI yields estimates of fractional anisotropy (FA), a measure of orientation and intravoxel coherence of water diffusion usually in white matter fibers, and diffusivity (<D>), a measure of the amount of intracellular and extracellular fluid diffusion. We tested the hypothesis that FA and <D> would be correlated with (i) the crossed–uncrossed difference (CUD), testing visuomotor interhemispheric transfer; and (ii) the redundant targets effect (RTE), testing parallel processing of visual information presented to each cerebral hemisphere. FA was lower and <D> higher in alcoholics than in controls. In controls but not alcoholics, large CUDs correlated with low FA and high <D> in total corpus callosum and regionally in the genu and splenium. In alcoholics but not controls, small RTEs, elicited with equiluminant stimuli, correlated with low FA in genu and splenium and high <D> in the callosal body. The results provide in vivo evidence for disruption of corpus callosum microstructure in normal aging and alcoholism that has functional ramifications for efficiency in interhemispheric processing.
Introduction
The corpus callosum is the thick band of white matter fibers connecting cortical areas of both hemispheres (Lent and Schmidt, 1993). Dysfunction of the corpus callosum can lead to deficits in sensory and cognitive integration (Gordon et al., 1971; Jancke et al., 1997; Yamauchi et al., 1997; Eliassen et al., 2000; Pfefferbaum et al., 2000a; Fabri et al., 2001). Several studies have demonstrated a relationship between the corpus callosum size and measures of interhemispheric transfer time (ITT) in split-brain and acallosal patients (Marzi et al., 1991; Forster and Corballis, 1998, 2000; Roser and Corballis, 2002) and in aging subjects (>60 years) who show only modest thinning of callosal structure (Jeeves and Moes, 1996). However, the relation between specific callosal regions and interhemispheric information exchange is not clear. Some authors have suggested that either anterior or posterior corpus callosum areas are involved in the interhemispheric integration of motor and sensory processes (Tassinari et al., 1994; Iacoboni and Zaidel, 1995), whereas others suggested that the body of the corpus callosum, connecting the motor cortices of the two hemispheres, mediates interhemispheric transmission (Berlucchi et al., 1971; Tomaiuolo et al., 2001).
Recently, we reported a relationship between interhemispheric processing and corpus callosum areas present in aging and alcoholism (Schulte et al., 2004). Using structural MRI we found significantly smaller areas of total corpus callosum, genu and body subregions in alcoholics than in controls, consistent with other in vivo studies (Hommer et al., 1996; Pfefferbaum et al., 1996). The behavioral measurements used in that study yielded two interhemispheric indices: (i) the crossed–uncrossed difference (CUD) and (ii) the redundant targets effect (RTE), described next.
The CUD indexes the difference between crossed and uncrossed reaction times relative to the responding hand (crossed: left hemifield/right hand and right hemifield/left hand; uncrossed: left hemifield/left hand, right hemifield/right hand) (Poffenberger, 1912). The difference reflects interhemispheric transfer time, because the uncrossed response can be processed within the same hemisphere, whereas crossed responses require transfer of visuomotor information between hemispheres normally via the corpus callosum (Corballis, 1998, 2002; Pollmann and Zaidel, 1998; Tettamanti et al., 2002; Iacoboni and Zaidel, 2004). We found that the CUD was significantly shorter in younger than in older subjects (Schulte et al., 2004) consistent with others (Reuter-Lorenz and Stanczak, 2000). Furthermore, we showed that the CUD was correlated with the corpus callosum total area and size of the callosum body in controls but not in alcoholics (Schulte et al., 2004), suggesting that in controls a larger corpus callosum, with more or larger fibers, enabled faster interhemispheric transfer time (Jancke and Steinmetz, 1994).
Another measure of interhemispheric integration is the RTE, testing parallel processing of visual information presented to each cerebral hemisphere (Reuter-Lorenz et al., 1995; Miniussi et al., 1998; Iacoboni et al., 2000). The RTE is defined by faster reaction times (RTs) to double stimulation than to single stimuli, a major determinant of the efficacy of sensorimotor performance (Miller, 1986; Mordkoff and Yantis, 1991; Roser and Corballis, 2003). Theoretically, small RTEs can be explained by probability, implying independent processing of the two stimuli, i.e. ‘winning the race’ to a processing goal between signals transmitted along different neural channels. But when enhancement of RTE exceeds probability measures, neural summation is needed to explain the amount of response facilitation (Miller, 1982). Split-brain studies provide evidence that the corpus callosum plays a role in the RTE (Reuter-Lorenz et al., 1995; Iacoboni et al., 2000). Reuter-Lorenz et al. (1995) have suggested that in the normal brain, response inhibition is released by unilateral as well as by bilateral input, but enhanced redundancy gain in complete callosotomy patients is due to a slowing of responses to unilateral stimuli because response inhibition can only be released with bilateral input. By contrast, Iacoboni et al. (2000) proposed in his dual attention model that each cerebral hemisphere has its own attentional system (Mangun et al., 1994; Arguin et al., 2000) that would result in enhanced activation with bilateral input in the split brain, due either to subcortical summation or to the enhancement of both ipsilateral and contralateral motor control.
With equiluminant stimuli that restrict visual input to the parvocellular system (Livingstone and Hubel, 1987), a reduced RTE in the split brain suggested an involvement of subcortical structures, i.e. the superior colliculus (Corballis, 1998), or cortico-subcortical interactions (Roser and Corballis, 2002; Schulte et al., 2004). We found that the RTE was more enhanced with equiluminant stimuli than with high luminance contrast stimuli and that this effect was smaller in older alcoholics than in younger alcoholics or controls, suggesting compromised interhemispheric neural summation. However, there was no significant correlation between RTE and areas of corpus callosum macrostructure in either alcoholics or controls (Schulte et al., 2004). Thus, although macrostructural measures of corpus callosum have yielded some associations with interhemispheric functioning, a more sensitive assessment of the microstructural changes of white matter region (e.g. demyelination, microtubule deterioration, and axonal deletion) may reveal robust relationships between this white matter structure and functional parameters occult to conventional structural imaging (for reviews, see Lim and Helpern, 2002; Kubicki et al., 2003; Pfefferbaum and Sullivan, 2003; Sullivan and Pfefferbaum, 2003).
Diffusion tensor imaging (DTI) permits examinations of the integrity of the microstructure of cerebral white matter by measuring the orientational displacement and distribution of water molecules in vivo across tissue components (Moseley et al., 1990; Baird and Warach, 1998; Le Bihan et al., 2001; Le Bihan, 2003; Pfefferbaum et al., 2003). Fractional anisotropy (FA) is a measure of orientational coherence, indexes white matter integrity (Pierpaoli and Basser, 1996), and is typically higher in fibers with a homogeneous or linear structure than in tissue with an inhomogenous structure, such as areas with pathology (Neumann-Haefelin et al., 2000; Lansberg et al., 2001) or crossing fibers (Virta et al., 1999; Pfefferbaum and Sullivan, 2003). The bulk mean diffusivity (<D>) of the diffusion tensor matrix provides a measure of the amount of diffusion and higher values indicate more diffusion, commonly due to larger presence of mobile fluid in the tissue sample (Pierpaoli et al., 2001; Pfefferbaum et al., 2003; Pfefferbaum and Sullivan, 2003). In white matter with relatively homogenous structure, such as the corpus callosum, the diffusion of the water molecules is restricted and bound in a structure with a primarily linear organization resulting in high FA and low diffusivity. Diffusion tensor measures are sufficiently sensitive to detect acute cerebral ischemia (Huisman, 2003), as well as white matter abnormalities in schizophrenia (Lim et al., 1999; Ardekani et al., 2003), multiple sclerosis (Ge et al., 2004), alcoholism (Pfefferbaum et al., 2000a, 2002) and normal aging (Pfefferbaum et al., 2000b; O'Sullivan et al., 2001; Sullivan et al., 2001; Pfefferbaum and Sullivan, 2003; Head et al., 2004; Madden et al., 2004). Several studies have shown that despite absence of macrostructural size variation with aging or alcoholism measured with conventional MRI, DTI detected anisotropy declines in regions of white matter, including the corpus callosum (Sullivan et al., 2001; Pfefferbaum and Sullivan, 2002, 2003).
In this study we used DTI for the first time to test the integrity of tissue microstructure of the corpus callosum (Basser and Pierpaoli, 1996) in relation to behavioral measures of CUD and RTE in healthy controls and in alcoholics. We tested the hypotheses that white matter microstructural integrity of the corpus callosum, indexed as high FA and low <D>, would be correlated with CUD and RTE. Furthermore, we tested the hypotheses that microstructural disruption of the corpus callosum in alcoholics relative to controls would relate to compromised ability of parallel processing of visual information (RTE) and increased interhemispheric transfer time (CUD).
Materials and Methods
Subjects
We studied 11 alcoholics (seven men and four women) and 13 controls (eight men and five women). Alcoholics were recruited from local rehabilitations programs, and controls were volunteers from the local community who participated in our earlier study, wherein the original report of the behavioral and conventional MRI data (Schulte et al., 2004). All subjects were screened with the Structural Clinical Interview for DSM-IV (American Psychiatric Association, 2000) and a clinical examination to rule out other Axis I diagnoses or substance abuse other than alcohol. Subject groups were well matched in age, handedness, and other demographic variables (see Table 1). The test of handedness Crovitz and Zener (1962) identified one subject in the alcohol group (score 34) and one subject in the control group (score 35) as just missing criterion for right handedness, where right handedness = 14–32, non-right = 33–49, and left handedness = 50–70. The median for all subjects was 18, for controls 15 and for alcoholics 22. For intelligence measurement we used the National Adult Reading Test (NART), which is widely employed in clinical settings to estimate pre-morbid intellectual levels. NART performance did not distinguish controls and alcoholics (see Table 1), who were neither demented nor amnesic.
Demographic data (mean ± SD) and statistical results for controls and alcoholics
| Age (years) | Lifetime alcohol intake (kg) | NART IQ | Education | |
|---|---|---|---|---|
| Controls | 51.6 ± 12.9 | 48.5 ± 70.5 | 113.4 ± 6.6 | 17.7 ± 1.8 |
| Alcoholics | 52.6 ± 11.0 | 511.3 ± 305.7 | 115.6 ± 3.9 | 16 ± 2.4 |
| t-test; P < | NS | 0.001 | NS | NS |
| Age (years) | Lifetime alcohol intake (kg) | NART IQ | Education | |
|---|---|---|---|---|
| Controls | 51.6 ± 12.9 | 48.5 ± 70.5 | 113.4 ± 6.6 | 17.7 ± 1.8 |
| Alcoholics | 52.6 ± 11.0 | 511.3 ± 305.7 | 115.6 ± 3.9 | 16 ± 2.4 |
| t-test; P < | NS | 0.001 | NS | NS |
NART IQ = National Adult Reading Test. NS, no significance.
Paradigm to Test CUD and RTE
Subjects sat in a darkened room 50 cm from a 17″ monitor and were stabilized by a forehead–chin rest to reduce head movement. They fixated on a point in the middle of a computer screen throughout the test and were instructed to sit with feet, legs, and arms separated to minimize the possibility of cross-cueing. The task was to press a button (Button-Box, PsyScope) as fast as possible whenever a stimulus appeared, whether a single or a double event. A warning tone (100 ms, ∼250 Hz) preceded visual stimulation. The inter-stimulus interval was randomly varied between 500, 700, 900 and 1100 ms. All stimuli were displayed for 100 ms. Four stimulus conditions were randomly presented: single stimulus presentation in either the left or the right visual field, simultaneous presentation of both stimuli in the left and the right hemifield, and catch trials (∼10%). Stimuli were filled white circular disks (210 cd/m2) on a black background (0.65 cd/m2) localized 9.4° left and right of the fixation point and ∼4.3° below the horizontal meridian (to avoid the blind spot). The CUD was calculated by subtracting the sum of crossed responses from the sum of uncrossed responses and dividing this difference by two.
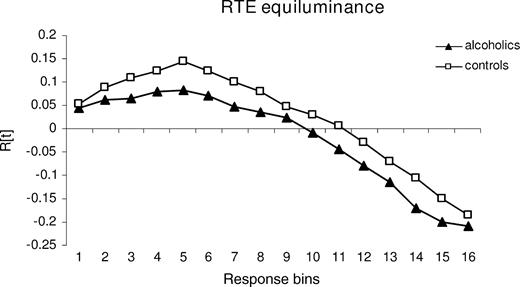
The graph R(t) was calculated for each subject by ranking the RTs for the three stimulus conditions (S1, S2, and S1S2). We defined a bin consisting of 10 RTs and computed a cumulative distribution function, counting the number of stimuli in each condition in the first bin containing the 10 shortest RTs, in the second bin containing the 20 shortest RTs and so on, cumulatively. Positive values indicate a higher number of fast responses elicited by bilateral than by unilateral trials within one bin, i.e. the amount of violation. For statistical analysis, the maximum violation was described by amplitude which quantifies the maximum number of fast responses to paired in relation to single targets within the cumulative distribution function (see Fig. 1) (Schulte et al., 2004).
RTE — tested with stimuli equiluminant to the background: cumulative plot of mean probabilities over response bins in alcoholics and controls. Positive values indicate response facilitation by redundant bilateral stimulation compared with unilateral stimulation that cannot be explained by probability measures and is therefore interpreted as response facilitation by neural summation mechanisms.
Other possibilities to quantify the amount of violation exist in addition to maximum violation. Corballis (2002), for example, used summed violation. However, a strong relation between the amplitude of the violation and the summed violation (control group, r = 0.94, P < 0.0001; alcohol group, r = 0.95, P < 0.0001, Pearson correlation) validates the use of the amplitude for description of the violation graph R(t). Thus, for correlation analysis with measures of callosal microstructural integrity we used the RTE amplitude with equiluminant stimuli.
To achieve equiluminance RTE stimuli were presented in a pale blue (118 cd/m2) on a yellow background (118 cd/m2). This is in accordance with the method described by Cavanagh et al. (1992) and Corballis (1998). We measured the light intensity three times at each of seven positions on a 17″ Apple flat screen (Measurement device: MAVOLUX from Gossen, http://www.gossen-photo.de/deutsch/lichtmess_produkte.html).
Each task comprised 380 stimulus trials, with 100 single left, 100 single right, 100 left and right stimulus presentations, and 80 catch trials in which no stimulus was presented. Stimulus conditions were randomly intermixed. The test block was initiated by the subject's pressing the button-box. Fixation performance was assessed using a short color-change of the fixation point in the middle of the screen between trials. RTs <150 ms (anticipations) and >600 ms (prolonged responses) were excluded from analysis. The total percentage of trials not entered in the analysis was 4.4%.
Diffusion Tensor Imaging
FA and diffusivity data were measured in the total corpus callosum and its substructures, the genu, body and splenium. FA, a measure of intravoxel coherence, ranges from 0 (lowest FA) to 1 (perfectly coherent anisotropy) and expresses the fraction of orientational coherence in an intravoxel level and is not affected by the intracranial volume of the supratentorium and thus, does not necessitate head size correction (Pierpaoli and Basser, 1996). <D> is expressed as area/time (e.g. 10−6mm2/s). DTI measurement of white matter microstructure is not linked to and is functionally different from size measurement.
Image Acquisition
As described previously (Pfefferbaum et al., 2003), an initial spin-echo midsagittal localizer scan (13, 4mm thick, contiguous slices; TR/TE = 300/14 ms; matrix = 256 × 256) was used to identify landmarks for prescription of all subsequent coronal scans. The superior/inferior (S/I) center position of the coronal acquisitions was chosen as the most inferior extent of the midpoint of the isthmus of the corpus callosum, and the extent of the prescription in the anterior/posterior (A/P) orientation subtended the entire brain for all subjects. The coronal MRI structural acquisitions included a dual-echo fast spin echo (FSE) sequence (47 4-mm-thick contiguous slices; TR/TE1/TE2 = 7500/14/98 ms; matrix = 256 × 192) and a Spoiled Gradient Recalled Echo (SPGR) sequence (94 slices; TR/TE = 25/5 ms, 2 mm thick, flip angle = 30°, matrix = 256 × 192). All images were zero-filled to 256 × 256 pixels in-plane by the scanner reconstruction software (1.5 T, GE Clinical MRI Systems, Milwaukee, MI).
DTI was performed in the coronal plane with the same slice location parameters as the dual-echo FSE, using a single shot spin-echo echo-planar imaging technique (4-mm-thick slices, 0 mm slice gaps, TR = 10 s, TE = 103 ms, matrix = 128 × 128). The amplitude of the diffusion-sensitizing gradients was 1.4 G/cm with 32 ms duration and 34 ms separation, resulting in a b-value of 860 s/mm2. Diffusion was measured along six non-collinear directions with alternating signs. For each gradient direction, six images were acquired and averaged. For each slice, six images with no diffusion weighting (b = 0 s/mm2) and one b = 0 s/mm2 image with an inversion recovery pulse were also acquired. The coronal structural MRI and DTI acquisitions produced either 2- or 4-mm-thick slices and were prescribed for consistent slice locations so that each 4-mm-thick slice precisely encompassed a pair of 2-mm-thick slices.
DTI Quantification
Eddy-current-induced image distortions due to the large diffusion encoding gradients cause spatial distortions in the diffusion-weighted images that vary from one diffusion direction to the next. These artifacts were minimized with information from the b = 0 inversion-recovery images, which do not suffer from such eddy current distortions. These images were used with a six-parameter affine correction on a slice-by-slice basis (Woods et al., 1998) to unwarp the eddy current distortions in the diffusion-weighted images. The inversion recovery image was used in the unwarping procedure to avoid inclusion of cerebro-spinal fluid in the reference image, which would result in excessive expansion of the diffusion-weighted images (de Crespigny and Moseley, 1998).
Using the averaged images with b = 0 and b = 860 s/mm2, six maps of the apparent diffusion coefficient (ADC) were calculated, each being a sum of three elements of the diffusion tensor. Solving the six equations with respect to ADCxx, ADCxy, etc. yielded the elements of the diffusion tensor. The diffusion tensor was then diagonalized, yielding eigenvalues of λ1, λ2 and λ3, as well as eigenvectors that define the predominant diffusion orientations. Based on the eigenvalues from the tensor, FA and <D> (that is, the average ADC of the three eigenvalues) were calculated on a voxel-by-voxel basis. Thus, each diffusion weighted study was reduced to a set of three images for each slice (FA, <D>, b = 0) to be used for analysis in conjunction with the anatomical images.
Image Registration, Reformatting and Warping to Common Coordinates
To place the images for all subjects into a coordinate system with a common origin and a standardized anatomical orientation, the anterior commissure (AC) and posterior commissure (PC) were manually identified on the SPGR images. The AC was shifted to a fixed coordinate in the A/P orientation, and the image volume was oriented by three rotations with the AC as the pivot point. The first rotation brought the PC level with the AC (as if the person nodded his head), the second one made the midsagittal plane vertical (as if the person tilted his head shoulder-to-shoulder), while the third rotated the PC to be on-axis with the AC in the axial plane (as if the person shook his head ‘no’). After this shift and rotations, the original oblique axial plane that passed through the AC and PC was a straight axial section perpendicular to the midsagittal plane.
The 47-slice, dual-echo FSE and SPGR images were passed through FSL Brain Extraction Tool (Smith, 2002) to extract the brain and exclude dura, skull, scalp and other non-brain tissue. The processed SPGR and FSE images were aligned (Woods et al., 1998) and the FSE-to-SPGR alignment parameters were used to align the DTI data to match the SPGR images. Finally, the parameters required to accomplish the standardized alignment transformation for each subject were applied to the FA, <D> and b = 0 images, the datasets were resliced to isotropic 1 mm3 voxels and the field-of-view was set to 20 cm for each axis. This image volume was large enough to encompass the entire brain for all subjects in the study.
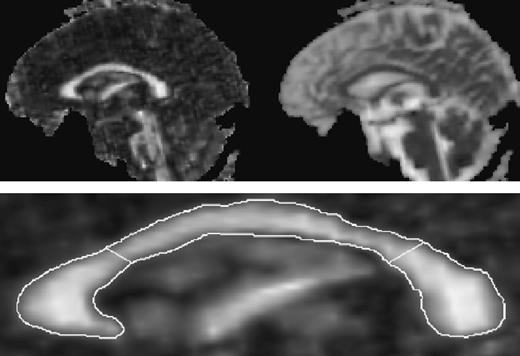
In order to quantify the FA of a given anatomic structure it is necessary to avoid using the FA signal itself to define a region of interest because low FA could be misinterpreted as a boundary. Thus the anatomic extent of the corpus callosum was manually traced on a display of the b = 0 midsagittal slice with comparable FA image also in view but not used as the primary determinant of the callosal area. The native but isotropically resliced data were used for callosal delineation (b = 0) and quantitation (FA and <D>) to accommodate echo-planar spatial distortions. After identification the corpus callosum outline was rotated placing the inferior aspects of the rostrum and splenium on a horizontal plane and the sillouette divided geometrically into genu, body and splenium regions (see Fig. 2) (Sullivan et al., 2002).
Top: full midsagittal FA (left) and <D> (right) image of a 61-year-old healthy man. Bottom: expanded midsagittal view of the FA image of the corpus callosum. The outline was manually drawn on the b = 0 image and superimposed onto the FA image for quantitation. Geometric lines divide the total corpus callosum into the genu (left), body (middle) and splenium (right).
Data Analysis
Group differences in FA and <D> were tested with analysis of variance (ANOVA). To examine the relationships predicted between DTI measures (FA and diffusivity) and the behavioral measures of interhemispheric transmission (CUD and RTE), we used Pearson correlation to test the predicted relationships in each group separately. The alpha level was set to 0.05 for all statistical tests and adjusted for multiple tests with Bonferroni correction, where α is divided by the number of tests.
Results
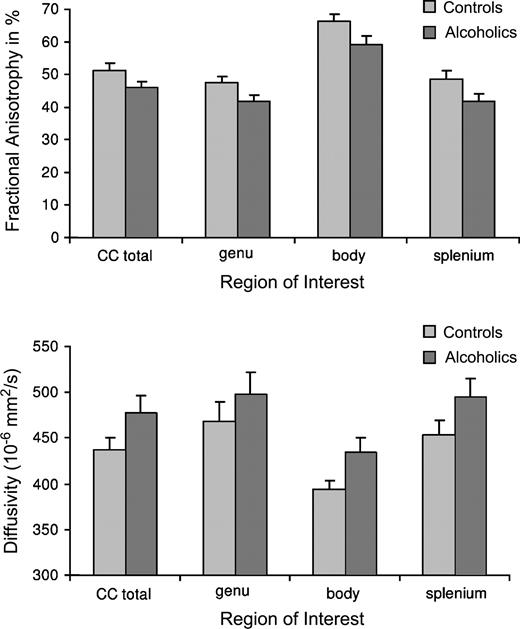
A repeated measures ANOVA for FA of the genu, body, and splenium as the within subject factor and group as the between subject factor revealed significant effects for corpus callosum regions [F(1,22) = 152.7, P < 0.0001; partial η2 = 0.87] and group [F(1,22) = 5.74, P = 0.03; partial η2 = 0.21], with higher FA in controls than in alcoholics. There was no group-by-region interaction [F(1,22) = 0.39, NS; partial η2 = 0.02]. The same analysis for diffusivity yielded significant effects for regions [F(1,22) = 22.4, P < 0.0001; partial η2 = 0.51] and a trend for group [F(1,22) = 2.82, P = 0.107; partial η2 = 0.11]. There was also no group-by-region interaction for diffusivity [F(1,22) = 0.32, NS; see Fig. 3].
Raw values (± SEM bars) for FA and <D> of the total callosum and the genu, body and splenium. Controls showed higher FA in all corpus callosum regions higher FA than alcoholics (top panel) and alcoholics had higher <D> than controls (bottom panel).
For FA, 87% of the total variability could be attributed to the callosal subregions and 21% to the group effect. For diffusivity, 51% of the total variability could be attributed to the callosal subregions and only 11% to the group effect.
Correlations between CUD and DTI Measures
Behaviorally, alcoholics showed a CUD of 4.5 ± 8.4 ms, which was not statistically different from the CUD of controls (5.3 ± 6.3 ms; t = 0.25, NS).
We predicted that longer CUD times would be related to low FA and high diffusivity and therefore report one-tailed Pearson correlations. In multiple comparisons of different dependent variables the only possibility for Bonferroni adjustment is to calculate a new p-value by dividing α by the number of comparisons tested. For correlation analysis of the three callosal subregions genu, body and splenium, a Bonferoni correction would require an alpha level of 0.017 (i.e. 0.05 divided by 3 tests).
Diffusivity
In the control group the CUD correlated significantly with <D> in total corpus callosum (r = 0.62, P < 0.01) and the genu (r = 0.71, P < 0.004), modestly in the splenium (r = 0.47, P = 0.053), but not in the body (r = 0.12, NS). By contrast, the alcohol group showed no significant correlation between CUD and <D> in any callosal measure (total corpus callosum, r = 0.11, NS; genu, r = 0.16, NS; body, r = 0.05, NS; splenium, r = 0.11, NS).
Fractional Anisotropy
In the control group, the pattern of relationships between CUD and FA was similar to that observed for diffusivity, but in the expected negative direction (total corpus callosum, r = −0.54, P = 0.03; genu, r = −0.48, P = 0.05; splenium, r = −0.51, P = 0.04; body, r = −0.11, NS). However, in the alcohol group, FA did not correlate significantly with total corpus callosum (r = 0.17, NS) or regionally (genu, r = 0.19, NS; body, r = 0.10, NS; splenium, r = 0.22, NS).
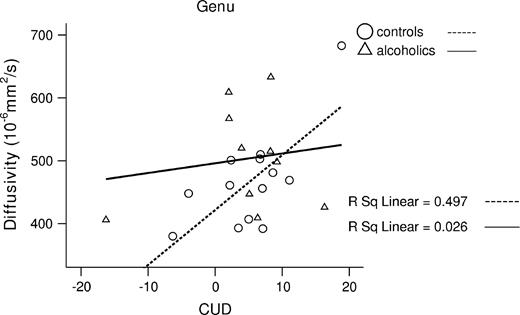
To test for a selective relationship between CUD and regional <D> in the controls, we conducted a stepwise regression analysis, in which CUD was the dependent variable and regional <D> values (genu, body and splenium) were the predictors. The total model accounted for 50% of variance in CUD [F(1,12) = 10.9, P = 0.007]. Genu <D> endured as a significant unique predictor of CUD (β = 0.71, t = 3.29, P = 0.007), after accounting for <D> in the body (β = 0.1, t = 0.44) and splenium (β = 0.02, t = 0.05) (see Fig. 4).
Higher <D> in the genu correlated with enhanced CUD in controls.
Correlations between RTE with Equiluminant Stimuli and DTI Measures
For RTE we had no directionality prediction and thus used two-tailed Pearson correlation. In the alcohol group, the RTE correlated significantly with higher FA in the total corpus callosum (r = 0.63, P = 0.04). With Bonferroni correction (for multiple comparison: P < 0.017 for three tests), the correlation with FA was marginally significant in genu (r = 0.62, P = 0.04) and splenium FA (r = 0.59, P = 0.055) but not significant in body FA (r = 0.43, NS). The correlations with <D> showed a different pattern: RTE significantly correlated with <D> in the body (r = −0.70, P = 0.017), but not genu (r = −0.35, NS) or splenium (r = −0.47, NS). None of these correlations was significant in controls. Correlations between RTE and genu FA, body FA and splenium <D> were of moderate magnitude but did not reach significance probably due to limited power.
We also conducted a stepwise regression analysis in alcoholics to test first for the relationship between RTE and FA, and second for the relationship between RTE and <D> with regional corpus callosum values (genu, body and splenium) predictors. The total model for FA accounted for 38% of variance in RTE [F(1,10) = 5.6 P = 0.04]. Here, genu FA was a significant unique predictor of RTE (β = 0.62, t = 2.34, P = 0.04), after accounting for FA in the body (β = 0.03, t = 0.07) and splenium (β = 0.20, t = 0.35) (see Fig. 5).
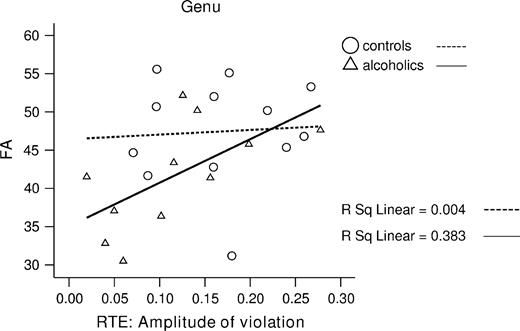
Lower FA in the genu correlated with small RTE in alcoholics.
The total model for <D> accounted for 48% of variance in RTE [F(1,10) = 8.5, P = 0.02]. Here, body <D> emerged as a significant unique predictor of RTE (β = −0.70, t = −2.9, P = 0.02), after accounting for <D> in the genu (β = 0.47, t = 1.3) and splenium (β = 0.13, t = 0.34) (see Fig. 6).
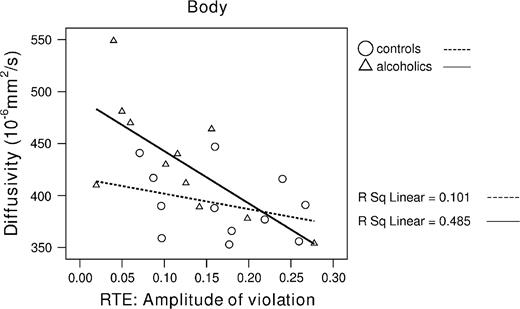
Higher diffusivity in the body correlated with small RTE amplitude in alcoholics.
Correlations between Lifetime Alcohol Intake, Age and DTI Measures
In the alcohol group, lifetime alcohol intake correlated significantly in the predicted direction with <D> (r = 0.73, P = 0.005) and FA in total corpus callosum (r = −0.67, P = 0.012). By contrast, the control group showed no significant correlation between lifetime alcohol intake and <D> (r = 0.10, NS) and FA in the total corpus callosum (r = 0.23, NS) (see Fig. 7).
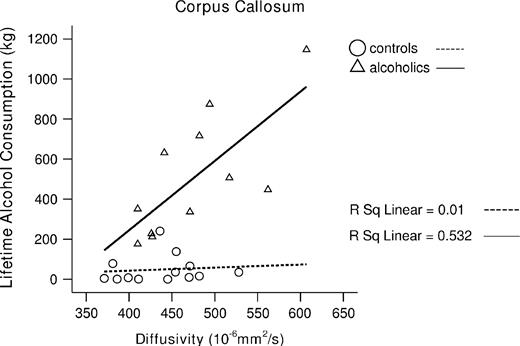
Greater lifetime alcohol consumption correlated with higher diffusivity of the total corpus in alcoholics.
In the control group, age correlated significantly with <D> (r = 0.76, P = 0.001) and FA in total corpus callosum (r = −0.55, P = 0.025). By contrast, the alcohol group showed no significant correlation between age and <D> (r = 0.36, NS) and FA in the total corpus callosum (r = −0.02, NS) (see Fig. 8).
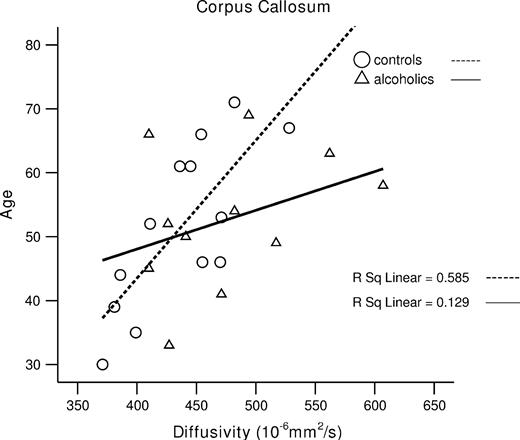
Older age correlated with higher diffusivity of the total corpus callosum in controls.
Correlation analysis showed no significant age effect on the behavioral measures and only a trend for CUD and age in alcoholics (CUD–age: alcoholics r = 0.58, P = 0.08, controls r = 0.35, NS; RTE–age: alcoholics r = −0.05, NS, controls r = 0.07, NS). Correlations between behavioral measures and DTI measures with age as the covariate remained essentially unchanged: in controls, genu <D>–CUD r = 0.67, P < 0.009; in alcoholics, genu FA–RTE r = 0.62, P < 0.03; body <D>–RTE r = −0.77, P < 0.005.
Discussion
We coupled DTI, a sensitive in vivo measure of early or subtle stages of white matter degradation, with tests of interhemispheric processing in alcoholics and healthy controls. FA, reflecting white matter microstructure integrity of the full extent of the corpus callosum (genu, body and splenium), was abnormally low in alcoholics. A trend for enhanced diffusivity was also present in all callosal regions in alcoholics relative to controls. This finding of reduced callosal FA is consistent with our prior studies (Pfefferbaum et al., 2000a; Pfefferbaum and Sullivan, 2002), which demonstrated a relationship between attentional and working memory deficits and significant white matter orientational coherence in nonamnesic alcoholics. The higher diffusivity in alcoholics may indicate increased intracellular and extracellular brain fluid and changes in myelin-associated bound water (cf. Pfefferbaum and Sullivan, 2005). In particular, lifetime alcohol consumption correlated with high diffusivity and low FA in alcoholics but not in controls, suggesting that alcoholism causes white matter microstructure disruption, possibly reflecting degradation of myelinated fibers in the corpus callosum. In support of this possibility, molecular studies have revealed that chronic alcohol consumption in rats produces disruption of cell cytoskeleton (Ren et al., 2000) quantified with decreased microtubule-associated protein-2 (MAP-2) mRNA levels in the extrapyramidal system, the mesolimbic system, the hypothalamus and the inferior colliculus (Putzke et al., 1998), i.e. in brain areas that are associated with motor functions.
In the present study, age was correlated with anisotropy (FA) declines and enhanced diffusivity in controls but not in alcoholics. This suggest that even though DTI is normally sensitive to aging (Pfefferbaum et al., 2000b; Head et al., 2004), lifetime alcohol consumption had a demonstrably greater effect than aging on disruption of brain white matter microstructure in alcoholics.
Relation between DTI Measures (FA and Diffusivity) of Callosal Fibers and CUD
The present study showed that the relationship between DTI measures of the structural integrity of callosal fibers and functional measures of interhemispheric processing differs for alcoholics and controls. In the control but not the alcoholic group, the CUD correlated significantly with diffusivity in total corpus callosum, and regionally, in the genu and splenium. Moreover, the relationships between CUD and FA were similar for diffusivity, but in the expected inverse direction, with low FA and high CUD implying less coherence of white matter and greater diffusivity (more free intra- and extracellular fluid) with prolonged CUD.
In a regression model, the CUD was best predicted by diffusivity in the genu of the corpus callosum. The genu connects prefrontal cortices involved in higher-order processing of motor control, planning, and execution functions that require the integration of information over time (Ongur et al., 2003; Brass and von Cramon, 2004). The CUD indexes additional time needed for crossed (left visual hemifield /right hand, right hemifield/left hand) compared with uncrossed (left hemifield/left hand, right hemifield/right hand) responses (Clarke and Zaidel, 1989). The association between CUD and genu diffusivity in controls suggests anterior interhemispheric exchange to integrate sensorimotor information between the two hemispheres and to prepare a motor response. Several lines of imaging research are consistent with our findings that both anterior and posterior callosal routes contribute to the CUD (Tassinari et al., 1994; Eliassen et al., 2000; Tettamanti et al., 2002). Others, however, reported that the crossed-uncrossed difference (CUD) (Iacoboni et al., 2000) and the redundant targets effect (RTE) (Reuter-Lorenz et al., 1995; Iacoboni et al., 2000) are unaffected by anterior lesions of the corpus callosum (Corballis et al., 2003). In healthy subjects, Iacoboni and Zaidel (2004) found in a recent fMRI study that anterior as well as posterior brain areas are involved in the CUD with the crossed compared to the uncrossed condition yielding greater activity in bilateral prefrontal, bilateral dorsal premotor, and right superior parietal areas. Also, Tettamanti et al. (2002) examined healthy subjects with fMRI and reported activations in a number of frontal, parietal and temporal brain regions and the genu of the corpus callosum that were specifically related to interhemispheric transmission of visuomotor information (CUD). However, white matter activations using fMRI measures are difficult to interpret and considered as problematic. BOLD activations reflecting hemodynamic changes within capillaries are consistently higher in cortical gray matter than in white matter regions (Hall et al., 2002), but combined analysis of DTI and fMRI data showed a positive correlation between maturation of white matter and BOLD response in several cortical and subcortical regions (Olesen et al., 2003). Combining structural MRI and EEG, Stancak et al. (2000) reported an association between lateralization of movement-related potentials and size of corpus callosum in a finger movement task. They found a positive correlation between genu size (and the anterior part of truncus of the corpus callosum) and enhanced pre-movement EEG potential over the ipsilateral sensory (S1) and motor (M1) responses areas, leading to the speculation that the contralateral hemisphere triggers the ipsilateral hemisphere to prepare for motor response via callosal connections (Tettamanti et al., 2002). In another functional MRI study, Iacoboni and Zaidel (2004) reported that crossed relative to uncrossed conditions (CUD) showed greater activity in bilateral prefrontal, bilateral dorsal premotor, and right superior parietal areas. Furthermore, signal enhancement in the right superior parietal cortex was correlated with the CUD, suggesting a key role of superior parietal cortex in interhemispheric visuo-motor integration. Activations of premotor and parietal cortex regions revealed with fMRI also map to fibers linking through the mid-body and anterior regions of the corpus callosum (Iacoboni and Zaidel, 2004).
Relation between DTI Measures (FA and Diffusivity) of Callosal Fibers and RTE
Behaviorally, we found more violations of the race model in the control group than in the alcohol group (Schulte et al., 2004). However, even in normal subjects, small RTEs have been reported supporting the race model (Corballis, 1998; Reuter-Lorenz et al., 1995; Roser and Corballis, 2002), but other studies observed enhanced RTE supporting the neural summation model (Miniussi et al., 1998; Savazzi and Marzi, 2002; Turatto et al., 2004). The controversial findings of small versus enhanced RTE in healthy subjects could be due to stimulus eccentricity and task difficulty (Miller and Ulrich, 2003). In our study, stimuli were presented more peripherally of the fixation point (9.4° right and left of the fixation point) and to control for saccadic eye movement, we implemented a color change of the fixation point, which additionally required sustained attention.
Previously, we failed to find associations between RTE and corpus callosum area using structural MRI (Schulte et al., 2004). Using DTI, by contrast, we have found that when redundant stimuli were equiluminant, the RTE amplitude was related to FA in genu and splenium and diffusivity in the body of the corpus callosum. Because redundant stimuli equiluminant with the background restrict processing to the parvocellular system, they may necessitate interhemispheric exchange via the corpus callosum, whereas redundant stimuli that contrast with background (high contrast) may be processed subcortically, e.g. via the superior colliculus (Corballis, 1998). All subjects, especially those with callosal pathology or compromise, showed prolonged RTs in the equiluminance compared with luminance contrast condition (Schulte et al., 2004). The increased processing demands of the more difficult task based on equiluminant stimuli may underlie the need for cortical processing and information exchange or comparison between the hemispheres. In alcoholics, the relationships between body diffusivity and genu FA with RTE provide evidence that subtle but significant microstructural disruption of white fiber tracts linking the hemispheres may be a significant neural mechanism underlying reduced response facilitation. By contrast, the control group did not show any correlation between the RTE amplitude and DTI measures. The RTE amplitude quantifies the degree of response time reduction under redundant stimulus presentation computed from the fastest reaction times and thus may be a sensitive measure when interhemispheric integration is slowed due to compromised fiber tracts connecting more anterior brain regions as seen in the alcoholics. Anterior parts of the corpus callosum connect homologous regions of the frontal lobe that may be more vulnerable than posterior brain regions to normal aging (Armstrong, 1990; Bartzokis, 2004) and to environmental influences, including alcoholism (Pfefferbaum et al., 2001). For example, Madden et al. (2004) found that the best predictor of a response in a visual task for younger adults was FA in the splenium of the corpus callosum, whereas for older subjects the best predictor was FA in the anterior limb of the internal capsule. Also, Iacoboni et al. (2000) suggest that the redundant targets effect requires intact anterior callosal fibers connecting the premotor cortices (see also Iacoboni and Zaidel, 2003). Thus, the controls, in whom the fiber tracts are more intact than in alcoholics, the relation between individual differences in RTE and corpus callosum structure integrity may be attenuated by a ceiling effect from callosal measures.
Conclusion
DTI is a suitable method for detecting subtle functional disorders (Le Bihan, 2003) not attributable to classical syndromes arising from disconnection of the hemispheres. The results of the present study provide in vivo evidence for disruption of white matter microstructure in alcoholism and suggest that interruption of white matter fiber coherence contributes to mild yet detectable disturbance in interhemispheric processing.
This study was supported by grants from the National Institute on Alcohol and Alcoholism (AA12388, AA05965, AA10723). The authors thank Anne O'Reilly, Anjali Deshmukh, Stephanie Sassoon, Andrea Spadoni, Marya Schulte and Carla Raassi for help with recruiting study participants and assistance in data collection, and Margaret Rosenbloom for constructive discussion about the data and manuscript.
References
American Psychiatric Association(
Ardekani BA, Nierenberg J, Hoptman MJ, Javitt DC, Lim KO (
Arguin M, Lassonde M, Quattrini A, Del Pesce M, Foschi N, Papo I (
Baird AE, Warach S (
Basser PJ, Pierpaoli C (
Bartzokis G, Sultzer D, Lu PH, Nuechterlein KH, Mintz J, Cummings JL (
Berlucchi G, Heron W, Hyman R, Rizzolatti G, Umilta C (
Brass M, von Cramon DY (
Clarke JM, Zaidel E (
Cavanagh P, Adelson EH, Heard P (
Corballis MC (
Corballis MC, Corballis PM, Fabri M (
Crovitz HF, Zener K (
de Crespigny A, Moseley M (
Eliassen JC, Baynes K, Gazzaniga MS (
Fabri M, Polonara G, Del Pesce M, Quattrini A, Salvolini U, Manzoni T (
Forster B, Corballis MC (
Forster B, Corballis MC (
Ge Y, Law M, Johnson G, Herbert J, Babb JS, Mannon LJ, Grossman RI (
Gordon HW, Bogen JE, Sperry RW (
Hall DA, Goncalves MS, Smith S, Jezzard P, Haggard MP, Kornak J (
Head D, Buckner RL, Shimony JS, Williams LE, Akbudak E, Conturo TE, McAvoy M, Morris JC, Snyder AZ (
Hommer D, Momenan R, Rawlings R, Ragan P, Williams W, Rio D, Eckardt M (
Huisman TA (
Iacoboni M, Zaidel E (
Iacoboni M, Zaidel E (
Iacoboni M, Zaidel E (
Iacoboni M, Ptito A, Weekes NY, Zaidel E (
Jancke L, Steinmetz H (
Jancke L, Wunderlich G, Schlaug G, Steinmetz H (
Jeeves MA, Moes P (
Kubicki M, Westin CF, Nestor PG, Wible CG, Frumin M, Maier SE, Kikinis R, Jolesz FA, McCarley RW, Shenton ME (
Lansberg MG, Thijs VN, O'Brien MW, Ali JO, de Crespigny AJ, Tong DC, Moseley ME, Albers GW (
Le Bihan D (
Le Bihan D, Mangin JF, Poupon C, Clark CA, Pappata S, Molko N, Chabriat H (
Lent R, Schmidt SL (
Lim KO, Hedehus M, Moseley M, de Crespigny A, Sullivan EV, Pfefferbaum A (
Livingstone MS, Hubel DH (
Madden DJ, Whiting WL, Huettel SA, White LE, MacFall JR, Provenzale JM (
Mangun GR, Luck SJ, Plager R, Loftus W, Hillyard SA, Handy T, Clark VP, Gazzaniga MS (
Marzi CA, Bisiacchi P, Nicoletti R (
Miller J (
Miller J (
Miller J, Ulrich R (
Miniussi C, Girelli M, Marzi CA (
Mordkoff JT, Yantis S (
Moseley ME, Cohen Y, Kucharczyk J, Mintorovitch J, Asgari HS, Wendland MF, Tsuruda J, Norman D (
Neumann-Haefelin T, Moseley ME, Albers GW (
Olesen PJ, Nagy Z, Westerberg H, Klingberg T (
Ongur D, Ferry AT, Price JL (
O'Sullivan M, Jones DK, Summers PE, Morris RG, Williams SC, Markus HS (
Pfefferbaum A, Sullivan EV (
Pfefferbaum A, Sullivan EV (
Pfefferbaum A, Sullivan EV (
Pfefferbaum A, Lim KO, Desmond JE, Sullivan EV (
Pfefferbaum A, Sullivan EV, Hedehus M, Adalsteinsson E, Lim KO, Moseley M (
Pfefferbaum A, Sullivan EV, Hedehus M, Lim KO, Adalsteinsson E, Moseley M (
Pfefferbaum A, Sullivan EV, Carmelli D (
Pfefferbaum A, Rosenbloom M, Sullivan EV (
Pfefferbaum A, Adalsteinsson E, Sullivan EV (
Pierpaoli C, Basser PJ (
Pierpaoli C, Barnett A, Pajevic S, Chen R, Penix LR, Virta A, Basser P (
Poffenberger AT (
Pollmann S, Zaidel E (
Putzke J, De Beun R, Schreiber R, De Vry J, Tolle TR, Zieglgansberger W, Spanagel R (
Ren LQ, Garrett DK, Syapin M, Syapin PJ (
Reuter-Lorenz PA, Stanczak L (
Reuter-Lorenz PA, Nozawa G, Gazzaniga MS, Hughes HC (
Roser M, Corballis MC (
Roser M, Corballis MC (
Schulte T, Pfefferbaum A, Sullivan EV (
Stancak Jr. A, Lucking CH, Kristeva-Feige R (
Sullivan EV, Pfefferbaum A (
Sullivan EV, Adalsteinsson E, Hedehus M, Ju C, Moseley M, Lim KO, Pfefferbaum A (
Sullivan EV, Pfefferbaum A, Adalsteinsson E, Swan GE, Carmelli D (
Tassinari G, Aglioti S, Pallini R, Berlucchi G, Rossi GF (
Tettamanti M, Paulesu E, Scifo P, Maravita A, Fazio F, Perani D, Marzi CA (
Tomaiuolo F, Nocentini U, Grammaldo L, Caltagirone C (
Turatto M, Mazza V, Savazzi S, Marzi CA (
Virta A, Barnett A, Pierpaoli C (
Woods RP, Grafton ST, Holmes CJ, Cherry SR, Mazziotta JC (
Author notes
1Neuroscience Program, SRI International, Menlo Park, CA 94025, USA, 2Department of Psychiatry and Behavioral Sciences, Stanford University School of Medicine, 401 Quarry Road, Stanford, CA 94305, USA and 3Department of Radiology, Stanford University School of Medicine, Stanford, CA 94305, USA