


Authors are unaware that Student's t-test is unreliable when variances differ between underlying populations.
Authors are aware of this but consider their samples to have similar variances.
Authors believe than the Mann–Whitney U test can effectively substitute for Student's t-test when variances are unequal.
Because the t distribution tends to the normal distribution for large sample sizes, authors may consider that their sample sizes are sufficiently large for concerns about unequal variance and nonnormality of the samples to be ignored.
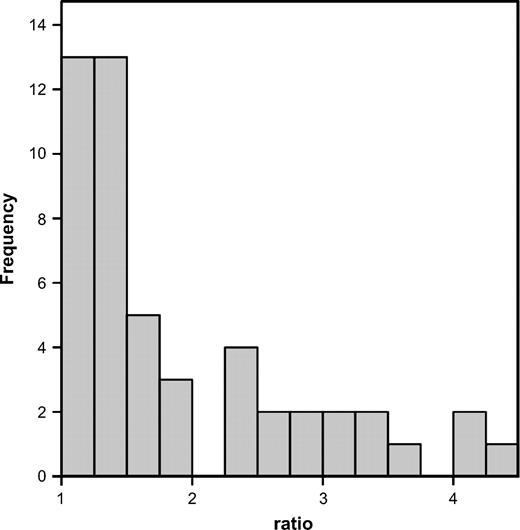
Histogram of the larger divided by the smaller variance for 35 t-tests and U tests in my sample from Behavioral Ecology for which the variances were provided in the paper. Note for ease of presentation, the following 3 variance ratios were not plotted: 9.0, 9.0, and 21.0.
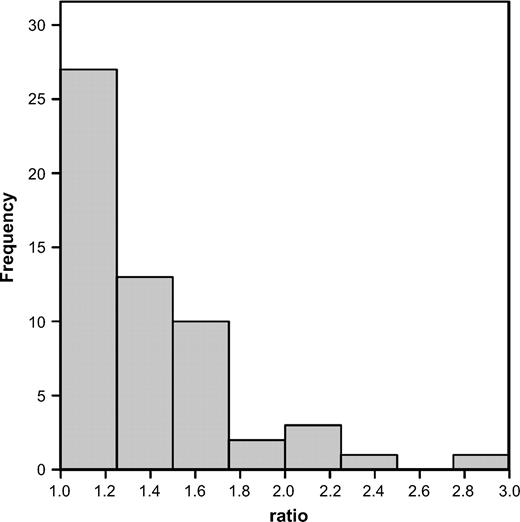
Histogram of the ratio of the highest over the lowest sample size for 61 Student's t-tests and Mann–Whitney U tests in my survey from Behavioral Ecology for which sample sizes were provided. For ease of presentation, the following four ratios were not plotted: 3.1, 3.3, 4.2, and 5.7.
The unequal variance t-test does not make the assumption of equal variances. Coombs et al. (1996) presented measured Type I errors obtained by simulated sampling from normal distributions for the Student's t-test and the unequal variance t-test (their result are summarized in Table 1). In the examples in Table 1, we see that the Type I error rate of the unequal variance t-test never deviates far from the nominal 5% value, whereas the Type I error rate for the Student's t-test was over 3 times the nominal rate when the higher variance was associated with the smaller sample size and less than a quarter the nominal rate when the higher variance was associated with the higher sample size. These results concur qualitatively with other studies of these 2 tests (e.g., Zimmerman and Zumbo 1993). Notice that even when the variances are identical, the unequal variance t-test performs just as effectively as the Student's t-test in terms of Type I error. The power of the unequal variance t-test is similar to that of the Student's t-test even when the population variances are equal (e.g., Moser et al. 1989; Moser and Stevens 1992; Coombs et al. 1996). Hence, I suggest that the unequal variance t-test performs as well as, or better than, the Student's t-test in terms of control of both Type I and Type II error rates whenever the underlying distributions are normal.
Calculated Type I error rate for the t-test and unequal variance t-test with a nominal α value of 0.05 (adapted from Coombs et al. 1996)
| N1 | N2 | s1 | s2 | t-test | Unequal |
|---|---|---|---|---|---|
| 11 | 11 | 1 | 1 | 0.052 | 0.051 |
| 11 | 11 | 4 | 1 | 0.064 | 0.054 |
| 11 | 21 | 1 | 1 | 0.052 | 0.051 |
| 11 | 21 | 4 | 1 | 0.155 | 0.051 |
| 11 | 21 | 1 | 4 | 0.012 | 0.046 |
| 25 | 25 | 1 | 1 | 0.049 | 0.049 |
| 25 | 25 | 4 | 1 | 0.052 | 0.048 |
The unequal variance t-test has no performance benefits over the Student's t-test when the underlying population variances are equal. Hence, you might consider that an effective way to conduct your analysis would be to perform an initial test for homogeneity of variance and then perform either a Student's t-test when the variances are equal or an unequal variance t-test when they are not. The problem with this flexible approach is that the combination of this preliminary test plus whichever of the subsequent tests is ultimately used controls Type I error rates less well than simply always performing an unequal variance t-test on every occasion (Gans 1992; Moser and Stevens 1992), this is one reason why it is generally unwise to decide whether to perform one statistical test on the basis of the outcome of another (Zimmerman 2004 and references therein). There are further reasons for not recommending preliminary tests of variances (e.g., Markowski CA and Markowski EP 1990; Quinn and Keough 2002, p. 42). Hence, I suggest avoiding preliminary tests and adopting the unequal variance t-test unless an argument based on logical, physical, or biological grounds can be made as to why the variances are very likely to be identical for the 2 populations under investigation.
It is important to remember that although the unequal variance t-test is more reliable than the Student's t-test in terms of violation of the assumption of homogeneity of variances, it is not necessarily any more reliable than the Student's t-test if the assumption of normality of the underlying populations is violated. However, Zimmerman and Zumbo (1993) argue that the unequal variance t-test performed on ranked data performs just as well as the Mann–Whitney U test (in terms of control of Type I errors) when variances are equal and considerably better than the U test when variances are unequal (see Table 2 for an example). This behavior was found when tested with populations coming from 8 different types of nonnormal distribution. Thus, Zimmerman and Zumbo (1993) suggest that the unequal variance t-test can effectively replace the Mann–Whitney U test if the data are first ranked before the test is applied. There are alternatives to the unequal variance t-test that perform even better, in particular, being more robust to nonnormality in the underling populations (e.g., Coombs et al. 1996; Keselman et al. 2004). However, I recommend the unequal variance t-test as having the best combination of performance and ease of use.
Calculated Type I error rate for the Mann–Whitney U test and the unequal variance t-test performed on the ranked data from normal distributions with a nominal α value of 0.05 (adapted from Zimmerman and Zumbo 1993)
| N1 | N2 | s1/s2 | U test | Unequal |
|---|---|---|---|---|
| 6 | 18 | 1 | 0.052 | 0.049 |
| 6 | 18 | 1.5 | 0.059 | 0.052 |
| 6 | 18 | 2 | 0.085 | 0.051 |
| 6 | 18 | 2.5 | 0.098 | 0.054 |
| 6 | 18 | 3 | 0.108 | 0.053 |
| 6 | 18 | 3.5 | 0.117 | 0.052 |
| 6 | 18 | 4 | 0.104 | 0.054 |
| 18 | 6 | 1 | 0.049 | 0.052 |
| 18 | 6 | 1.5 | 0.038 | 0.054 |
| 18 | 6 | 2 | 0.030 | 0.056 |
| 18 | 6 | 2.5 | 0.028 | 0.059 |
| 18 | 6 | 3 | 0.030 | 0.064 |
| 18 | 6 | 3.5 | 0.025 | 0.066 |
| 18 | 6 | 4 | 0.023 | 0.063 |
I have used the name unequal variance t-test as this is its most common name in the literature, you may also find in referred to as the Welch test deriving from Welch (1938, 1947). Welch actually proposed several ways to evaluate the degrees of freedom, and the method I describe in Equations 4 and 5 is sometimes referred to as the Welch Approximate Degrees of Freedom (APDF) test. Note that statistical packages may use other methods for calculating the degrees of freedom. You may also encounter the unequal variances t-test called simply the unpooled variances t-test or Satterwaite's test or the Welch–Satterthwaite test, after Satterwaite (1946). You may also find it called as the Smith/Welch/Satterwaite test, acknowledging the work in Smith (1936).
The importance of considering whether or not to pool variances extends beyond the simple case of comparing 2 groups. Julious (2005) argues against the standard practice of using the pooled variance across all groups when performing a comparison between 2 groups from several used in an analysis of variance. Indeed, Julious (2005) argues that using a pooled variance across more than 2 groups can be even more serious than the issues covered in this paper. No matter the number of groups, the decision as to whether to pool or not also needs careful consideration in the construction of randomization tests as well as the analytic tests considered here.
IN CONCLUSION: A STEP-BY-STEP SUMMARY
If you want to compare the central tendency of 2 populations based on samples of unrelated data, then the unequal variance t-test should always be used in preference to the Student's t-test or Mann–Whitney U test. To use this test, first examine the distributions of the 2 samples graphically. If there is evidence of nonnormality in either or both distributions, then rank the data. Take the ranked or unranked data and perform an unequal variance t-test. Draw your conclusions on the basis of this test. Note that some packages (e.g., SPSS) perform a Student's t-test and unequal variances t-test simultaneously and provide output for both. The experimenter ought to have decided which test they consider most appropriate beforehand and thus look at the output for that test alone, ignoring the other.
In presenting the outcome of the unequal variance t-test, provide a suitable reference for the adoption of the test and its exact formulation (e.g., Moser et al. 1989 or this paper) as well as providing the mean, variance, and number of samples in each group, the calculated t′ value, the calculated degrees of freedom (v), and finally the P value.
Thanks to Steven Julious and 2 anonymous referees for helpful comments on a previous version.
References
Coombs WT, Algina J, Oltman D.
Keselman HJ, Othman AR, Wilcox RR, Fradette K.
Markowski CA, Markowski EP.
Moser BK, Stevens GR, Watts CL.
Quinn GP, Keough MJ.
Satterwaite FE.
Smith H.
Welch BL.
Welch BL.
Zimmerman DW, Zumbo BN.
