


Abstract
Physiologic studies suggest that sleep restriction has metabolic effects that predispose to weight gain. The authors investigated the association between self-reported usual sleep duration and subsequent weight gain in the Nurses' Health Study. The 68,183 women who reported habitual sleep duration in 1986 were followed for 16 years. In analyses adjusted for age and body mass index, women sleeping 5 hours or less gained 1.14 kg (95% confidence interval (CI): 0.49, 1.79) more than did those sleeping 7 hours over 16 years, and women sleeping 6 hours gained 0.71 kg (95% CI: 0.41, 1.00) more. The relative risks of a 15-kg weight gain were 1.32 (95% CI: 1.19, 1.47) and 1.12 (95% CI: 1.06, 1.19) for those sleeping 5 and 6 hours, respectively. The relative risks for incident obesity (body mass index: >30 kg/m2) were 1.15 (95% CI: 1.04, 1.26) and 1.06 (95% CI: 1.01, 1.11). These associations remained significant after inclusion of important covariates and were not affected by adjustment for physical activity or dietary consumption. These data suggest that short sleep duration is associated with a modest increase in future weight gain and incident obesity. Further research is needed to understand the mechanisms by which sleep duration may affect weight.
Obesity has become a global epidemic. The prevalence of adult obesity in the United States has more than doubled from 15 percent in the late 1970s to 31 percent by 2000 (1). Parallel to the increase in weight has been a reduction in sleep times. With the pressures of a two-wage-earner household and the growth of round-the-clock entertainment through cable television and the Internet, the time set aside for sleep has diminished. Only 35 percent of American adults were obtaining 8 hours of sleep in 1998, and that number had further fallen to 26 percent by 2005 (2).
Cross-sectional studies in children have repeatedly found an association between reduced sleep and increased weight (3–5). Similar findings have been observed in cross-sectional studies of adults, suggesting that those who sleep less than 7 hours per night are more likely to be obese (6–8). However, these studies cannot differentiate cause from effect. Obesity is a strong risk factor for diseases such as sleep apnea and arthritis that may limit an individual's ability to sleep. On the other hand, a recent study from Switzerland demonstrated an association between sleep time and future weight (9). However, the generalizability of these results is unclear, as this study selected subjects with a high risk for psychiatric disorders. In addition, the bidirectional temporal associations found in that study suggest the possibility of a shared etiology for short sleep and obesity rather than a direct causal effect.
If a causal association between sleep deprivation and weight gain exists, it may be particularly important in middle-aged women. The reduced sleep that often results from menopausal symptoms may play a role in the weight gain commonly associated with menopause. In addition, nocturnal eating is much more common among women than men (10).
The mechanisms by which sleep restriction might affect weight are unclear. Restricted sleep may lead to daytime fatigue and therefore reduced activity. In addition, experimental studies suggest that sleep deprivation can cause alterations in serum leptin and ghrelin levels, resulting in increased hunger and appetite (11).
We hypothesized that reduced sleep predisposes to increased weight gain due to a combination of increased caloric intake and reduced activity. We sought to test these hypotheses using a large prospective cohort of middle-aged women.
MATERIALS AND METHODS
Women participating in the Nurses' Health Study who responded to a question about sleep duration in 1986 and were free of cardiovascular disease, cancer, and diabetes at that time formed the study population for this work. Because of data suggesting that the impact of reduced sleep wanes with age (8, 9), participants' data were censored when they reached 65 years of age. The Nurses' Health Study cohort was established in 1976 when 121,700 female married registered nurses, aged 30–55 years, completed a mailed questionnaire on their medical history and lifestyle. The original sampling strategy for this cohort has been previously described (12). Every 2 years, follow-up questionnaires are sent to update information on potential risk factors and to identify newly diagnosed illnesses. The protocol for the study was approved by the Human Research Committee of Brigham and Women's Hospital. In 1986, subjects were asked to “indicate total hours of actual sleep in a 24-hour period.” This question has been previously validated against 1 week of sleep diaries (r = 0.79) in this cohort (13).
Measures of weight
On each biennial questionnaire, participants were asked their current weight to the nearest pound. Data from eight subsequent questionnaires, spanning 16 years, were used as the outcome measures for these analyses. The most recent questionnaire was from June 2002. Self-reported weight in this cohort has been previously shown to closely correlate (r = 0.96; mean difference: 1.5 kg) with measured weight (14). Height obtained from the baseline questionnaire in 1976 was used to convert weight to body mass index. The absolute change in weight (kg) over time was assessed as a continuous outcome. Two discrete outcomes were also assessed as measures of weight gain: the development of clinical obesity (body mass index: >30 kg/m2) and a weight gain of 15 kg or more. In analyses adjusting for body mass index, baseline body mass index was divided into deciles.
Statistical analysis
Differences in baseline characteristics by sleep duration were compared by use of the chi-squared test and analysis of variance for dichotomous and continuous variables, respectively. Multivariate linear regression modeling was used to estimate the mean weight gain over time for each category of sleep duration from 5 hours or less to 9 hours or more. Cox proportional hazards regression modeling was used to estimate the hazard ratio for the development of obesity or significant weight gain for each sleep duration category relative to the referent group. A sleep duration of 7 hours per night was chosen as the referent category because it is the median sleep duration from both the Sleep in America poll and the Nurses' Health Study (2, 13).
All models were adjusted for age (in 1-year categories). Additional baseline covariates for which simultaneous adjustment was made included smoking status (never smoker, former smoker, current smoker of <15 cigarettes/day, current smoker of 15–25 cigarettes/day, current smoker of >25 cigarettes/day), alcohol consumption (none, <5 g/day, 5–15 g/day, and >15 g/day), caffeine consumption (in quintiles), spousal education (less than high school diploma, high school diploma, college degree, graduate degree), use of medications known to affect sleep and/or weight (benzodiazepines, phenothiazines, thyroid hormone, and sex hormones), menopausal status, snoring frequency (none, occasional, regular), and shift-working history (none, <5 years, ≥5 years). Secondary analyses were conducted that included depressive symptoms (defined as a score below 52 on the Mental Health Inventory of the Medical Outcomes Survey 36-item short form (SF-36)) and antidepressant use. Information about depression was first obtained in 1992 and on antidepressant use in 1996.
Additional modeling was performed with covariate adjustment for dietary variables as well as physical activity in order to explore the causal pathway linking sleep duration to weight gain. Nutritional data were obtained from a food frequency questionnaire. These frequencies were combined with nutritional composition information to estimate total caloric intake, fruit and vegetable servings, fiber, trans-fat, and the ratio of polyunsaturated fat to saturated fat. Each of these variables was divided into quintiles for the purposes of these analyses. Validation studies have found that these dietary variables are reproducible (intraclass r = 0.55–0.64) and have moderate correlation with values obtained from detailed dietary records where women used dietetic scales to weigh food servings (r = 0.48–0.59) (15).
Levels of physical activity were obtained from questions regarding the average frequency with which women participated in a number of activities. Previous validation studies have reported moderate to high correlations with recall of the past week's activities (r = 0.79–0.83) and with 1 week of activity diaries in which participants recorded their activity at hourly intervals (r = 0.59–0.62) (16). Each activity was assigned a metabolic equivalent task (MET) score based on the classification by Ainsworth et al. (17). The sum of these scores provides a measure of overall voluntary activity. The level of activity was divided into quintiles.
For the proportional hazards models, age, smoking, antidepressant and sex hormone use, menopausal status, and physical activity were updated every 2 years, while alcohol, caffeine, depression, and dietary variables were updated every 4 years, on the basis of availability of covariate data.
Linear mixed-effects modeling was utilized to model simultaneously the effect of sleep duration on both baseline weight and weight over time. This was done by including sleep duration, time, and sleep duration × time interaction terms as fixed effects in the model as well as a random intercept term. Age grouped into 5-year bins was included as a covariate. Standard errors were calculated with the empirical variance estimator. All statistical analyses were conducted using SAS, version 8.2, software (SAS Institute, Inc., Cary, North Carolina).
RESULTS
A total of 68,183 women aged 39–65 years and free of comorbid disease responded to both the sleep and weight questions on the 1986 Nurses' Health Study questionnaire. Median follow-up in this cohort was 12 years.
Baseline characteristics are reported in table 1. Overall, 4.3 percent of women slept 5 hours or less, 25.5 percent slept 6 hours, 42.1 percent slept 7 hours, 23.5 percent slept 8 hours, and 4.5 percent slept 9 hours or more. In general, women who slept less were slightly older, drank less alcohol, but were more likely to smoke and consume more caffeine. Short-duration sleepers were also much more likely to have worked overnight shifts.
Baseline characteristics of subjects by sleep duration category, Nurses' Health Study, 1986*
Sleep duration (hours/24-hour period) | p value† | |||||||||
|---|---|---|---|---|---|---|---|---|---|---|
| ≤5 | 6 | 7 | 8 | ≥9 | ||||||
| No. of subjects | 2,953 | 17,406 | 28,717 | 16,047 | 3,060 | |||||
| Age, years | 53.1 (6.8) | 52.4 (6.9) | 52.2 (7.0) | 52.6 (7.1) | 52.8 (7.2) | <0.0001 | ||||
| Weight, kg | 69.6 (15.6) | 68.3 (14.0) | 67.0 (12.8) | 67.4 (13.0) | 68.2 (13.9) | <0.0001 | ||||
| Body mass index, kg/m2 | 26.1 (5.5) | 25.5 (4.9) | 24.9 (4.5) | 25.0 (4.6) | 25.4 (4.9) | <0.0001 | ||||
| Physical activity, METs‡/week | 14 (23) | 14 (20) | 15 (21) | 14 (21) | 12 (16) | <0.0001 | ||||
| Alcohol, g/day | 5 (10) | 6 (10) | 6 (10) | 7 (12) | 8 (14) | <0.0001 | ||||
| Current smoker, % | 24 | 24 | 21 | 20 | 23 | <0.0001 | ||||
| Premenopausal, % | 28 | 33 | 37 | 36 | 37 | <0.0001 | ||||
| Husband with college degree, % | 45 | 52 | 56 | 57 | 56 | <0.0001 | ||||
| Benzodiazepine use, % | 4.9 | 3.8 | 3.5 | 3.6 | 4.9 | <0.0001 | ||||
| Phenothiazine use, % | 0.7 | 0.6 | 0.6 | 0.7 | 1.6 | <0.0001 | ||||
| Thyroid hormone use, % | 8.2 | 8.3 | 7.9 | 7.6 | 8.4 | 0.12 | ||||
| Hormone replacement therapy use, % | 16 | 17 | 18 | 18 | 17 | 0.06 | ||||
| Regular snorer, % | 10 | 10 | 8 | 9 | 11 | <0.0001 | ||||
| Shift working for ≥5 years, % | 30 | 21 | 16 | 15 | 17 | <0.0001 | ||||
| Dietary daily intake | ||||||||||
| Total, kcal | 1,723 (559) | 1,743 (531) | 1,772 (516) | 1,786 (522) | 1,832 (547) | <0.0001 | ||||
| Polyunsaturated fat, g | 11 (5) | 12 (5) | 12 (5) | 12 (5) | 13 (5) | <0.0001 | ||||
| Saturated fat, g | 23 (9) | 23 (9) | 23 (9) | 23 (9) | 24 (9) | <0.0001 | ||||
| trans-unsaturated fat, g | 3 (2) | 3 (2) | 3 (2) | 3 (2) | 3 (2) | <0.0001 | ||||
| Fiber, g | 19 (8) | 19 (8) | 19 (7) | 19 (8) | 19 (8) | <0.0001 | ||||
| Fruits and vegetables, no. of servings | 5 (3) | 5 (2) | 5 (2) | 5 (2) | 5 (2) | <0.0001 | ||||
| Caffeine, mg | 321 (260) | 312 (240) | 294 (223) | 280 (217) | 276 (229) | <0.0001 | ||||
Data are expressed as the mean (standard deviation) or as percentages.
p value comparison across sleep duration groups using analysis of variance for continuous variables and the chi-squared test for dichotomous variables.
METs, metabolic equivalent tasks.
Voluntary activity levels were similar between short- and average-duration sleepers (14 METs/week in those sleeping 6 hours or less per day vs. 15 METs/week in those sleeping 7 hours per day). Despite their greater weight at baseline, short-duration sleepers reported less caloric intake than did long-duration sleepers.
Increase in weight
A clear cross-sectional relation between sleep duration and weight was found. After age adjustment, those sleeping 5 hours or less weighed on average 2.47 kg (95 percent confidence interval (CI): 1.97, 2.98) more at baseline than did those sleeping 7 hours, and those sleeping 6 hours were 1.24 kg (95 percent CI: 0.99, 1.29) heavier. Not only was a difference in baseline weight apparent but also weight increased more rapidly in those sleeping the least (figure 1).
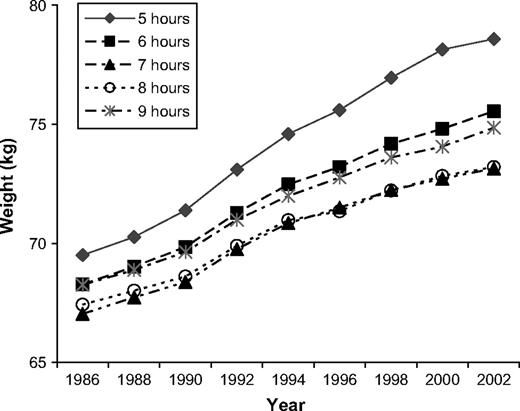
Mean age-adjusted weight of the Nurses' Health Study cohort from 1986 to 2002 as a function of habitual sleep duration in 1986.
In multivariate models, short sleep duration remained associated with an increased weight gain relative to those sleeping 7 hours (table 2). After adjustment for age and baseline body mass index, the mean weight gain over 4 years was 1.82 kg (95 percent CI: 1.52, 2.12), 1.59 kg (95 percent CI: 1.50, 1.68), 1.31 kg (95 percent CI: 1.24, 1.37), 1.31 kg (95 percent CI: 1.22, 1.40), and 1.32 kg (95 percent CI: 1.09, 1.55) in those sleeping ≤5, 6, 7, 8, and ≥9 hours, respectively. In other words, those sleeping 5 hours or less gained 0.52 kg (95 percent CI: 0.28, 0.75) more, and those sleeping 6 hours gained 0.29 kg (95 percent CI: 0.17, 0.40) more than did those sleeping 7 hours. No significant difference was found among those sleeping 7, 8, or 9 hours or more. This relation between reduced sleep and increased weight gain persisted over time. After 10 years, the mean age- and body mass index-adjusted weight gains for sleep durations of ≤5, 6, 7, 8, and ≥9 hours were 5.63 kg (95 percent CI: 5.17, 6.10), 5.16 kg (95 percent CI: 5.02, 5.30), 4.91 kg (95 percent CI: 4.80, 5.01), 4.74 kg (95 percent CI: 4.61, 4.88), and 4.91 kg (95 percent CI: 4.56, 5.26), respectively. Those sleeping 5 hours or less gained 0.73 kg (95 percent CI: 0.37, 1.10), and those sleeping 6 hours gained 0.26 kg (95 percent CI: 0.08, 0.43) more than did participants sleeping 7 hours. Adjustment for potential confounders did not substantially affect this pattern. Further inclusion of activity and dietary variables also had little effect on this relation.
Mean weight gain (kg) above baseline weight in 1986 for each sleep duration category relative to the gain in those sleeping 7 hours, Nurses' Health Study, 1986–2002
Sleep duration (hours/24-hour period) | |||||||||||||||||
|---|---|---|---|---|---|---|---|---|---|---|---|---|---|---|---|---|---|
| ≤5 | 6 | 7 | 8 | ≥9 | |||||||||||||
| Mean | 95% confidence interval | Mean | 95% confidence interval | Mean | Mean | 95% confidence interval | Mean | 95% confidence interval | |||||||||
| Age-adjusted model | |||||||||||||||||
| 1990 | 0.34 | 0.10, 0.57 | 0.21 | 0.10, 0.32 | 0.00 | 0.00 | −0.12, 0.11 | −0.06 | −0.29, 0.17 | ||||||||
| 1994 | 0.69 | 0.38, 1.00 | 0.26 | 0.11, 0.41 | 0.00 | 0.01 | −0.14, 0.17 | 0.19 | −0.12, 0.50 | ||||||||
| 1998 | 0.96 | 0.52, 1.39 | 0.50 | 0.29, 0.70 | 0.00 | 0.00 | −0.21, 0.21 | 0.18 | −0.23, 0.60 | ||||||||
| 2002 | 0.94 | 0.28, 1.59 | 0.67 | 0.37, 0.97 | 0.00 | −0.05 | −0.35, 0.26 | 0.45 | −0.16, 1.05 | ||||||||
| Age- and body mass index-adjusted model | |||||||||||||||||
| 1990 | 0.52 | 0.28, 0.75 | 0.29 | 0.17, 0.40 | 0.00 | 0.00 | −0.11, 0.12 | 0.01 | −0.21, 0.24 | ||||||||
| 1994 | 0.74 | 0.43, 1.06 | 0.28 | 0.13, 0.43 | 0.00 | 0.01 | −0.14, 0.17 | 0.20 | −0.10, 0.51 | ||||||||
| 1998 | 1.02 | 0.59, 1.45 | 0.51 | 0.30, 0.71 | 0.00 | −0.01 | −0.21, 0.20 | 0.22 | −0.19, 0.64 | ||||||||
| 2002 | 1.14 | 0.49, 1.79 | 0.71 | 0.41, 1.00 | 0.00 | −0.06 | −0.36, 0.24 | 0.49 | −0.11, 1.09 | ||||||||
| Fully adjusted model* | |||||||||||||||||
| 1990 | 0.41 | 0.17, 0.64 | 0.23 | 0.12, 0.35 | 0.00 | 0.03 | −0.09, 0.14 | 0.04 | −0.19, 0.27 | ||||||||
| 1994 | 0.59 | 0.28, 0.91 | 0.20 | 0.05, 0.35 | 0.00 | 0.06 | −0.09, 0.21 | 0.26 | −0.04, 0.57 | ||||||||
| 1998 | 0.78 | 0.34, 1.21 | 0.38 | 0.18, 0.58 | 0.00 | 0.05 | −0.16, 0.26 | 0.27 | −0.14, 0.68 | ||||||||
| 2002 | 0.78 | 0.13, 1.44 | 0.53 | 0.23, 0.82 | 0.00 | 0.02 | −0.29, 0.32 | 0.51 | −0.09, 1.11 | ||||||||
Fully adjusted model adjusted for age, baseline body mass index, smoking, alcohol consumption, caffeine intake, spousal level of education, medication use, menopausal status, snoring status, shift-working history, physical activity, total caloric intake, dietary fiber, ratio of polyunsaturated to saturated fat, trans-fat intake, and servings of fruits and vegetables.
The mixed-effects model gave qualitatively similar results. At baseline, compared with those sleeping 7 hours, women sleeping 5 hours or less weighed 2.54 kg (95 percent CI: 1.97, 3.11) more, and those sleeping 6 hours weighed 1.29 kg (95 percent CI: 1.03, 1.54) more. Weight gain over time was also greater in short-duration sleepers. Over 10 years, the age-adjusted weight gain in women sleeping 5 and 6 hours, respectively, was 0.62 kg (95 percent CI: 0.27, 0.96) and 0.28 kg (95 percent CI: 0.14, 0.42) more than in women sleeping 7 hours.
Major weight gain
Over the 16 years considered, 7,164 women (10.5 percent) experienced a 15-kg weight gain over 754,316 person-years of follow-up. Those sleeping 7–8 hours per night had the lowest risk for major weight gain (table 3). Women sleeping 6 hours were 12 percent more likely to have a 15-kg weight gain, and women sleeping 5 hours or less were 32 percent more likely. Covariate adjustment did not substantially weaken this association. In addition, no change in the relative risk was noted after further adjustment for caloric intake and voluntary activity.
Sleep duration (hours/24-hour period) | |||||||||||||||||
|---|---|---|---|---|---|---|---|---|---|---|---|---|---|---|---|---|---|
| ≤5 | 6 | 7 | 8 | ≥9 | |||||||||||||
| Hazard ratio | 95% confidence interval | Hazard ratio | 95% confidence interval | Hazard ratio | Hazard ratio | 95% confidence interval | Hazard ratio | 95% confidence interval | |||||||||
| 15-kg weight gain | |||||||||||||||||
| Model 1‡ | 1.32 | 1.19, 1.47 | 1.12 | 1.06, 1.19 | 1.00 | 1.00 | 0.94, 1.06 | 1.07 | 0.95, 1.20 | ||||||||
| Model 2§ | 1.28 | 1.15, 1.43 | 1.11 | 1.04, 1.17 | 1.00 | 1.00 | 0.94, 1.07 | 1.05 | 0.94, 1.18 | ||||||||
| Model 3¶ | 1.28 | 1.15, 1.42 | 1.10 | 1.04, 1.17 | 1.00 | 1.00 | 0.94, 1.07 | 1.04 | 0.92, 1.16 | ||||||||
| Obesity | |||||||||||||||||
| Model 1‡ | 1.15 | 1.04, 1.26 | 1.06 | 1.01, 1.11 | 1.00 | 1.03 | 0.97, 1.08 | 1.05 | 0.95, 1.17 | ||||||||
| Model 2§ | 1.16 | 1.05, 1.28 | 1.07 | 1.01, 1.12 | 1.00 | 1.03 | 0.97, 1.08 | 1.03 | 0.93, 1.14 | ||||||||
| Model 3¶ | 1.15 | 1.04, 1.27 | 1.06 | 1.01, 1.12 | 1.00 | 1.03 | 0.97, 1.09 | 1.03 | 0.93, 1.14 | ||||||||
| Stratified analyses# (obesity) | |||||||||||||||||
| <25 kg/m2 | 1.58 | 1.25, 1.99 | 1.21 | 1.07, 1.36 | 1.00 | 0.97 | 0.85, 1.10 | 1.17 | 0.92, 1.49 | ||||||||
| 25–30 kg/m2 | 1.14 | 1.02, 1.27 | 1.06 | 1.00, 1.12 | 1.00 | 1.03 | 0.97, 1.09 | 1.06 | 0.95, 1.19 | ||||||||
“Obesity” defined as a body mass index of greater than 30 kg/m2.
Analyses of 15-kg weight gain include all 68,183 women, while analyses of obesity were conducted among the 58,863 women who were not obese in 1986 (39,814 women with a body mass index of <25 kg/m2 and 19,049 women with a body mass index of ≥25 kg/m2).
Model 1: adjusted for age, year of follow-up, and baseline body mass index.
Model 2: adjusted for the variables in model 1 plus smoking, alcohol consumption, caffeine intake, spousal level of education, medication use, menopausal status, snoring status, and shift-working history.
Model 3: adjusted for the variables in model 2 plus physical activity, total caloric intake, dietary fiber, ratio of polyunsaturated to saturated fat, trans-fat intake, and servings of fruits and vegetables.
Stratified analyses present results restricted to those women in a particular body mass index category at baseline and were adjusted for age and year of follow-up.
Sleep duration (hours/24-hour period) | |||||||||||||||||
|---|---|---|---|---|---|---|---|---|---|---|---|---|---|---|---|---|---|
| ≤5 | 6 | 7 | 8 | ≥9 | |||||||||||||
| Hazard ratio | 95% confidence interval | Hazard ratio | 95% confidence interval | Hazard ratio | Hazard ratio | 95% confidence interval | Hazard ratio | 95% confidence interval | |||||||||
| 15-kg weight gain | |||||||||||||||||
| Model 1‡ | 1.32 | 1.19, 1.47 | 1.12 | 1.06, 1.19 | 1.00 | 1.00 | 0.94, 1.06 | 1.07 | 0.95, 1.20 | ||||||||
| Model 2§ | 1.28 | 1.15, 1.43 | 1.11 | 1.04, 1.17 | 1.00 | 1.00 | 0.94, 1.07 | 1.05 | 0.94, 1.18 | ||||||||
| Model 3¶ | 1.28 | 1.15, 1.42 | 1.10 | 1.04, 1.17 | 1.00 | 1.00 | 0.94, 1.07 | 1.04 | 0.92, 1.16 | ||||||||
| Obesity | |||||||||||||||||
| Model 1‡ | 1.15 | 1.04, 1.26 | 1.06 | 1.01, 1.11 | 1.00 | 1.03 | 0.97, 1.08 | 1.05 | 0.95, 1.17 | ||||||||
| Model 2§ | 1.16 | 1.05, 1.28 | 1.07 | 1.01, 1.12 | 1.00 | 1.03 | 0.97, 1.08 | 1.03 | 0.93, 1.14 | ||||||||
| Model 3¶ | 1.15 | 1.04, 1.27 | 1.06 | 1.01, 1.12 | 1.00 | 1.03 | 0.97, 1.09 | 1.03 | 0.93, 1.14 | ||||||||
| Stratified analyses# (obesity) | |||||||||||||||||
| <25 kg/m2 | 1.58 | 1.25, 1.99 | 1.21 | 1.07, 1.36 | 1.00 | 0.97 | 0.85, 1.10 | 1.17 | 0.92, 1.49 | ||||||||
| 25–30 kg/m2 | 1.14 | 1.02, 1.27 | 1.06 | 1.00, 1.12 | 1.00 | 1.03 | 0.97, 1.09 | 1.06 | 0.95, 1.19 | ||||||||
“Obesity” defined as a body mass index of greater than 30 kg/m2.
Analyses of 15-kg weight gain include all 68,183 women, while analyses of obesity were conducted among the 58,863 women who were not obese in 1986 (39,814 women with a body mass index of <25 kg/m2 and 19,049 women with a body mass index of ≥25 kg/m2).
Model 1: adjusted for age, year of follow-up, and baseline body mass index.
Model 2: adjusted for the variables in model 1 plus smoking, alcohol consumption, caffeine intake, spousal level of education, medication use, menopausal status, snoring status, and shift-working history.
Model 3: adjusted for the variables in model 2 plus physical activity, total caloric intake, dietary fiber, ratio of polyunsaturated to saturated fat, trans-fat intake, and servings of fruits and vegetables.
Stratified analyses present results restricted to those women in a particular body mass index category at baseline and were adjusted for age and year of follow-up.
The effect of varying the definition of major weight gain is shown in figure 2. Relative to sleeping 7 hours, sleeping for 5 hours or less was associated with increased risk of weight gain across a range of definitions from 10 kg to 25 kg. The relative risk associated with 5 hours of sleep increased as the criterion for weight gain grew more stringent from 1.23 (95 percent CI: 1.14, 1.32) for a 10-kg increase to 1.46 (95 percent CI: 1.18, 1.80) for a 25-kg increase.
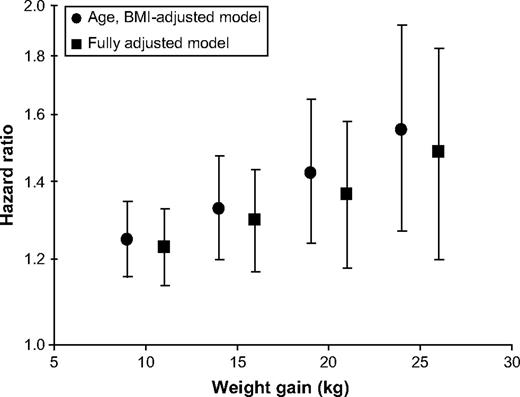
Hazard ratio associated with 5 hours or less of sleep relative to 7 hours of sleep in the Nurses' Health Study cohort from 1986 to 2002 for major weight gain defined as a 10-, 15-, 20-, or 25-kg increase over baseline weight in 1986. The fully adjusted models were adjusted for age, baseline body mass index (BMI), smoking, alcohol, caffeine, spousal level of education, medication use, menopausal status, snoring status, shift-working history, physical activity, total caloric intake, dietary fiber, ratio of polyunsaturated to saturated fat, trans-fat, and servings of fruits and vegetables. Bars, 95% confidence interval.
Obesity
A total of 8,185 women met criteria for obesity at baseline and so were excluded, leaving 59,813 women for this analysis. Of these women, 9,509 new cases of obesity (15.9 percent) were identified over 651,824 person-years of follow-up. As shown in table 3, the risk of developing obesity was elevated for those sleeping less than 7 hours, with a 15 percent increase in risk for those sleeping 5 hours or less and a 6 percent increase in those sleeping 6 hours. On the other hand, sleeping more than 7 hours was not associated with an increased risk. Covariate adjustment including dietary and activity variables had only a trivial effect on this relation with less than 7 hours of sleep remaining an independent risk factor for future obesity.
The effect of short-duration sleep on obesity risk was greatest among those who were leanest at baseline (table 3). The relative risk of obesity associated with 5 hours or less of sleep compared with 7 hours is 1.58 (95 percent CI: 1.25, 1.99) in those with a body mass index of less than 25 kg/m2 compared with 1.14 (95 percent CI: 1.02, 1.27) in those with a body mass index of 25 kg/m2 or more. A similar trend was found in those sleeping 6 hours.
Secondary analyses
Analyses were repeated with censoring of women at the time of diagnosis of diabetes in order to exclude weight gain due to antidiabetic medication use. The effects of sleep duration on absolute weight gain, major weight gain, and obesity were no different in this subgroup analysis. Analyses adjusting for depression and antidepressant use were also performed. Again, the relation between short-duration sleep and weight gain was unaffected.
DISCUSSION
Cross-sectional associations between reduced sleep times and increased weight have been appreciated for some time (3–8). Although a recent study provided longitudinal data suggesting that reduced sleep is associated with an increased risk for future obesity, the small sample size and selection of subjects on the basis of psychopathology potentially limit the generalizability of those results (9). Another study found that the increase in body mass index over 10 years was greater in short-duration sleepers, but the finding was not statistically significant (8). In the present study, we have demonstrated, in a sample of middle-aged women up to 65 years of age, that a habitual sleep time of less than 7 hours predicts increased future weight gain independent of baseline weight.
Sleeping 5 hours or less led to about a 1-kg increase in weight over 16 years compared with sleeping 7–8 hours. Although this increase may appear small, even modest weight gain can have important health effects. Relative to maintaining a stable weight, a 5-kg weight gain nearly doubles the risk of developing diabetes (18). Furthermore, usual sleep times of less than 7 hours are associated with a substantial increase in the risk of major (≥15 kg) weight gain and incident obesity.
How might sleep affect body weight? Hypothalamic-pituitary functions, including those that influence eating, energy balance, and metabolism, are strongly tied to circadian rhythms and are highly integrated with sleep regulatory processes. Disruption of the circadian clock can have important metabolic effects. Knock out of the Clock gene, an integral component of the circadian clock, in mouse models leads to obesity and metabolic dysfunction (19). Neurons in the hypothalamus producing orexin are involved in the regulation of both feeding and wakefulness, and aberrations in orexin-mediated pathways may provide one link between sleep and obesity. Experiments in lean humans have found that short-term sleep restriction has important effects on cortisol, glucose tolerance, and growth hormone secretion (20, 21).
Ultimately, in order to cause weight gain, reduced sleep must increase caloric intake and/or reduce energy expenditure. Short-term sleep restriction lowers levels of the satiety-promoting hormone, leptin, increases levels of the appetite-promoting hormone, ghrelin, and increases subjective ratings on appetite and hunger (11). An association among reduced sleep time, depressed leptin, and increased ghrelin has also been found in a large, cross-sectional study, suggesting that these effects may persist with long-term sleep restriction (22). In our cohort, however, we did not find a relation between short-duration sleep and increased caloric intake. In fact, increased dietary consumption was associated with greater sleep durations.
Another possible explanation for the observed relation is that the fatigue produced by limiting sleep may reduce physical activity and thus energy expenditure, thereby predisposing to weight gain. However, we found little relation between sleep duration and reported physical activity. Although effects on voluntary activity cannot be conclusively excluded because of the limitations of questionnaire-based measurements of activity, this finding is consistent with that from the study by Hasler et al. (9), which also found that changes in purposeful physical activity could not explain the sleep-weight association.
Other mechanisms influencing energy expenditure exist. The largest contributor to energy expenditure in a sedentary person is the basal metabolic rate. Recent work has suggested that sleep can affect the metabolic rate through effects on thermogenesis. Sleep restriction has been demonstrated in rodent models to influence the expression of uncoupling proteins, which regulate metabolic rate through thermogenesis (23, 24). Further work on how sleep can impact the metabolic rate in humans is clearly needed.
In addition, recent work suggests that involuntary movements such as posture (sitting vs. standing) and fidgeting can have important effects on weight regulation. Studies have found that increased involuntary activity in humans is associated with an ability to resist weight gain despite overfeeding and that lean individuals expend 350 kcal more per day on this type of activity than do the obese (25, 26). Interestingly, in rats, orexin appears to increase this type of energy expenditure (27).
Other potential explanations for our findings include the possibility of a common cause of both sleep duration and weight gain. Although we attempted to control for potential confounders, we cannot exclude the possibility of residual confounding through variables not considered (such as corticosteroid use) or through incomplete adjustment. For example, the effect of depression on both sleep and weight could not be completely accounted for, as the first measurements of depression in this cohort occurred after the sleep question was asked. Finally, because sleep duration was assessed at only one time point, we cannot definitively exclude the possibility of reverse causation.
Several limitations to this work should be noted. First, all measurements were based on questionnaire response and so are liable to misclassification. However, the misclassification of sleep duration is likely nondifferential with respect to weight gain, so any resulting bias should be toward the null hypothesis, leading to underestimation of the true magnitude of association between sleep and weight. Usual sleep time is likely to have varied somewhat over the 16-year period of follow-up, but this also would likely bias the study toward a null result. Finally, it should be noted that this cohort was limited to middle-aged women in the nursing profession and primarily Caucasian. Further research will be needed before generalizing these findings to other populations, such as men, or other age groups.
Overall, our findings suggest that short-sleep duration is associated with a modest increase in future weight gain and incident obesity. These findings have the important implication that increasing sleep time among those sleeping less than 7 hours per night may represent a novel approach to obesity prevention. Given the inadequacies of current obesity therapy, the ability of public health initiatives focusing on sleep hygiene to slow the epidemic of weight gain should be investigated, as should the mechanisms linking sleep duration to obesity.
This work was supported by research grants DK58845, P30 DK46200, CA87969, AG024837, HL073146, and HL081385 from the National Institutes of Health and by the American Heart Association.
Atul Malhotra is a consultant for Respironics, Inc. (Murrysville, Pennsylvania), Restore Medical, Inc. (St. Paul, Minnesota), and Inspiration Medical, Inc. (Redwood City, California); a speaker for Sepracor, Inc. (Marlborough, Massachusetts), Pfizer, Inc. (New York, New York), and Respironics, Inc.; and a grant recipient from Respironics, Inc., and Restore Medical, Inc. David P. White is the Chief Medical Officer for Respironics, Inc.; a consultant for Aspire Medical (Palo Alto, California), Itamar Medical, Inc. (Framingham, Massachusetts), PAVAD Medical, Inc. (Fremont, California), and WideMed, Ltd. (Vero Beach, Florida); and the recipient of research grants from WideMed, Ltd., Respironics, Inc., and Cephalon, Inc. (Frazer, Pennsylvania).
References
Flegal KM, Carroll MD, Ogden CL, et al. Prevalence and trends in obesity among US adults, 1999–2000.
National Sleep Foundation. 2005 “Sleep in America” poll. Washington, DC: National Sleep Foundation,
von Kries R, Toschke AM, Wurmser H, et al. Reduced risk for overweight and obesity in 5- and 6-y-old children by duration of sleep—a cross-sectional study.
Sekine M, Yamagami T, Hamanishi S, et al. Parental obesity, lifestyle factors and obesity in preschool children: results of the Toyama Birth Cohort study.
Sugimori H, Yoshida K, Izuno T, et al. Analysis of factors that influence body mass index from ages 3 to 6 years: a study based on the Toyama cohort study.
Vioque J, Torres A, Quiles J. Time spent watching television, sleep duration and obesity in adults living in Valencia, Spain.
Cournot M, Ruidavets JB, Marquie JC, et al. Environmental factors associated with body mass index in a population of southern France.
Gangwisch JE, Malaspina D, Boden-Albala B, et al. Inadequate sleep as a risk factor for obesity: analyses of the NHANES I.
Hasler G, Buysse DJ, Klaghofer R, et al. The association between short sleep duration and obesity in young adults: a 13-year prospective study.
Benca RM, Schenck CH. Sleep and eating disorders. In: Kryger MH, Roth T, Dement WC, eds. Principles and practices of sleep medicine. 4th ed. Philadelphia, PA: Elsevier, Inc,
Spiegel K, Tasali E, Penev P, et al. Brief communication: sleep curtailment in healthy young men is associated with decreased leptin levels, elevated ghrelin levels, and increased hunger and appetite.
Colditz GA, Manson JE, Hankinson SE. The Nurses' Health Study: 20-year contribution to the understanding of health among women.
Patel SR, Ayas NT, Malhotra MR, et al. A prospective study of sleep duration and mortality risk in women.
Willett W, Stampfer MJ, Bain C, et al. Cigarette smoking, relative weight, and menopause.
Willett WC, Sampson L, Stampfer MJ, et al. Reproducibility and validity of a semiquantitative food frequency questionnaire.
Wolf AM, Hunter DJ, Colditz GA, et al. Reproducibility and validity of a self-administered physical activity questionnaire.
Ainsworth BE, Haskell WL, Leon AS, et al. Compendium of physical activities: classification of energy costs of human physical activities.
Colditz GA, Willett WC, Rotnitzky A, et al. Weight gain as a risk factor for clinical diabetes mellitus in women.
Turek FW, Joshu C, Kohsaka A, et al. Obesity and metabolic syndrome in circadian Clock mutant mice.
Spiegel K, Leproult R, Van Cauter E. Impact of sleep debt on metabolic and endocrine function.
Spiegel K, Leproult R, Colecchia EF, et al. Adaptation of the 24-h growth hormone profile to a state of sleep debt.
Taheri S, Lin L, Austin D, et al. Short sleep duration is associated with reduced leptin, elevated ghrelin, and increased body mass index.
Koban M, Swinson KL. Chronic REM-sleep deprivation of rats elevates metabolic rate and increases UCP1 gene expression in brown adipose tissue.
Levine JA, Eberhardt NL, Jensen MD. Role of nonexercise activity thermogenesis in resistance to fat gain in humans.
Levine JA, Lanningham-Foster LM, McCrady SK, et al. Interindividual variation in posture allocation: possible role in human obesity.

