


Abstract
The authors developed a self-administered 181-item food frequency questionnaire (FFQ) to assess dietary intake during pregnancy for Finnish women from August 1995 to July 1996. In the validation study (n = 113), the data that were collected by using two 5-day food records completed during the eighth month of pregnancy were compared with FFQ data. The intake of foods and nutrients was higher as determined by FFQ than that assessed using food records. Pearson correlation coefficients for nutrients, after adjustment for energy, ranged from 0.19 (vitamin E) to 0.70 (thiamin) and, for foods, from 0.03 (high-fat milk) to 0.84 (low-fat milk). Energy adjustment improved the correlations for nutrients. Correction for attenuation improved correlations for both foods and nutrients. On average, 70% of the foods and 69% of the nutrients fell into the same or adjacent quintiles, according to the FFQ and the food record. In the reproducibility study, 111 women completed the FFQs twice at a 1-month interval. The intraclass correlation coefficients for nutrients ranged from 0.42 (ethanol) to 0.72 (sucrose, riboflavin, and calcium), and for foods, they ranged from 0.44 (ice cream) to 0.91 (coffee). The authors conclude that the FFQ has an acceptable reproducibility and represents a useful tool for categorizing pregnant women according to their dietary intake.
There is increasing evidence that nutrients may be important in the development of some chronic diseases during fetal life (1). Observations suggesting that the destruction of the insulin-producing beta cells may begin before birth (2) led us to develop a food frequency questionnaire (FFQ) to be able to assess the diet of pregnant women in a prospective study on the development and determinants of type 1 diabetes (www.utu.fi/research/dipp). FFQs have been shown to be an appropriate method for assessing diet in a wide variety of epidemiologic settings, including studies among pregnant women (3–7). In comparison with short-term food records, the FFQ provides a better approximation of the habitual diet over a longer period (8). Although FFQs are not considered appropriate for estimating actual nutrient intake, they can be used for categorizing persons accurately according to intake and for identifying subjects at the extremes of intake. Among the feasible comparative methods available for validating an FFQ, food records are likely to have the smallest correlated errors (8) and have therefore been commonly used for this purpose.
The objective of this study was to assess the reproducibility and validity of a 181-item FFQ among women in the third trimester of pregnancy.
MATERIALS AND METHODS
Study design
The participants in the reproducibility study completed the FFQ twice at a 1-month interval and at the beginning and the end of the eighth month of pregnancy (figure 1). The participants in the validation study completed the FFQ 1 month before the start of the pregnancy leave (at the beginning of the eighth month of pregnancy) and 1 month after delivery. Food records were kept for 10 days (twice during 5 consecutive days at least 1 week apart) during the month preceding the pregnancy leave. The food record was chosen as the reference method since it is reliable for measuring the actual food consumption of an person and since its errors do not usually correlate with those of the food frequency method. Ethical approval for this study was obtained from the Ethical Committee of Oulu University Medical School and the Ethics Committee of the Public Health Care Department, City of Oulu, Finland.
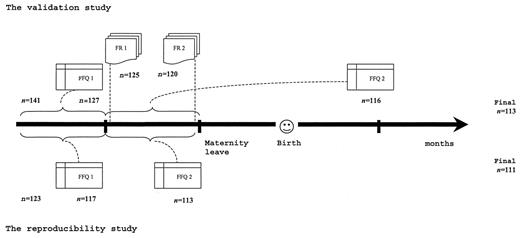
The design of the validation study among pregnant Finnish women, August 1995 to July 1996. FFQ, food frequency questionnaire; FR, food record.
Subjects
All of the pregnant women in their third trimester who were attending 13 maternity clinics in the city of Oulu between August 1995 and April 1996 were personally invited by their midwives to take part in the study. The women were alternately asked to participate in either the reproducibility study or the validation study.
Of the 123 pregnant women invited to take part in the reproducibility study, 111 (90 percent) completed the study. The reasons given for refusing to take part were moving to another area (n = 2) and complications during pregnancy (n = 1). Two women reported no reason. Among the 118 women who agreed to continue, 117 returned the first questionnaire and 113 returned the second. The results of two women were excluded from the analysis because of poorly completed questionnaires.
Altogether, 141 pregnant women were invited to participate in the validation study. Five women refused due to the strain of record keeping, and four refused because of complications in their pregnancies. Two women reported no specific reason. Of the 130 subjects who agreed to continue, 127 returned the first FFQ, 125 returned the first 5-day food record, 120 returned the second 5-day food record, and, finally, 116 returned the second FFQ. The reasons for giving up on the study included the burden of record keeping (n = 5) and premature birth (n = 2), while no reason was given by seven subjects. In the analysis, the results from three women were excluded because of incomplete food records. As a result, the final sample for the validation study comprised 113 women (80 percent of those invited). One recording day was removed for one participant and two for another woman due to gastroenteritis.
Sociodemographic data were collected by using a structured questionnaire. The participants in the validation study were similar to those in the reproducibility study with respect to age (mean, 29.6 years (5.1 standard deviation (SD))), body mass index at the beginning of pregnancy (mean, 22.7 (3.5 SD) for the validation study vs. 22.9 (3.2 SD) kg/m2 for the reproducibility study), the proportion of women educated for at least 13 years (72 for the validation study vs. 75 percent for the reproducibility study), and number of previous pregnancies (median =1 for both groups). The distribution of all subjects by age and education was representative of pregnant Finnish women in general (9).
FFQ
Pietinen et al. (10, 11) developed a food use questionnaire of 276 food items for measuring the dietary intake of 29,000 healthy, middle-aged Finnish men participating in the Alpha-Tocopherol Beta-Carotene Cancer Prevention Study. That questionnaire was further modified into a semiquantitative FFQ comprising 110 food items for studying the diet of Finnish women participating in the Kuopio Breast Cancer Study (12). When further developing that questionnaire, we were able to use the information on the food consumption of women of childbearing age living in four different areas in Finland (North Karelia, Kuopio Province, Turku-Loimaa, and the capital area of Helsinki-Vantaa) collected by using food records in the Finrisk Study (13) 1 year before our field study. The questionnaire was specifically designed to reflect the Finnish food consumption habits. The “recipe” behind each food item was now weighted by the frequencies of consumption in the food group considered (e.g., the recipe for breakfast cereals consists of rice crisps, 33 percent; corn flakes, 23 percent; cereals with added sugar, 22 percent; and Weetabix (Weetabix Company, Kettering, Northants, United Kingdom), 22 percent). We used open-frequency categories in increasing order: less than once per month and how many times per month, week, or day. The serving sizes were based on commonly used portions identified during earlier Finnish dietary studies (14, 15), and for some foods (e.g. eggs and beverages), natural units were used.
The FFQ was designed to assess the entire diet over a period of 1 month. The main aim was to rank persons according to their food consumption and nutrient intake. The questionnaire comprised 181 food items and mixed dishes, grouped under subheadings: “milk products,” “potato, rice, and pasta as a side dish,” “cereals,” “fat on bread/spreads,” “fruits and berries,” “vegetables,” “salad dressings,” “warm main courses,” “fish and eggs,” “beverages,” and “desserts, sweets, and snacks.” There were additional empty lines for each food group to record foods not listed on the questionnaire. Moreover, questions were asked about where the meals were usually eaten (at home, in a cafeteria/restaurant) and the type of fat used in food preparation, baking, and salad dressings. Intake from dietary supplements was not included in this analysis, since this analysis focused on foods and nutrients obtained from the diet only.
We developed a software program linking the food frequency data with the nutrient software program developed at the National Public Health Institute, Helsinki, Finland (16). The program can accommodate the women's personal choices for fat (in cooking, baking, and salad dressings), which were asked about on the questionnaire. In the validation study, we took into account the women's personal choices for fat in cooking. We used butter in cooking in all recipes for those subjects who generally ate their meals at home and used butter in cooking. For other subjects, we determined the recipe fat to be butter, margarine, and oil in equal proportions, assuming that people who eat lunch at work do not usually know what type of fat is used in cooking.
Food records
Food consumption data were collected by means of two 5-day estimated food records. The first record was kept during weeks 29–32 of gestation, and the second was kept during weeks 33–36 of gestation. The time interval between the two records had to be at least 1 week. The food records covered 4 weekdays and 1 weekend day. The investigator (M. Karppinen) set the days to be recorded during the first meeting with the study subject, and these were mutually agreed upon. Each subject was then instructed to record everything she consumed during the recording periods. A booklet with 126 pictures of common food items and mixed dishes was used to facilitate the estimation of portion sizes (15). Immediately after each recording period, the records were checked at the maternity clinics by the investigator who also guided the record keeping by giving participants personal and written instructions in advance. Two university students who were majoring in human nutrition coded the dietary records.
Analysis of food consumption data
The food consumption data were analyzed by using a software program developed at the National Public Health Institute (16). The food composition database of the National Public Health Institute is continuously updated and is the most comprehensive one in Finland. Nutrient values in the food composition database are derived mainly from chemical analyses of Finnish foods. In addition, complementary data are obtained from the Finnish food industry and international food composition tables. The database currently includes about 1,600 individual food items and mixed dishes and more than 200 nutrients and other dietary factors. The system allows creation or modification of specific recipes, and the women's personal recipes were used whenever possible. However, standard recipes in the database are based on current Finnish cookbooks.
Statistical methods
The reproducibility study. Means and standard deviations for food consumption and nutrient intake were calculated for both of the questionnaires. Intraclass correlation was used to measure the reproducibility between the first and the second questionnaires. Intraclass correlation measures the fraction of total variation that is due to between-individual variability. A high value for the coefficient means a low within-person variation.
The degree of misclassification across categories between the FFQ and the dietary records was examined by dividing food consumption and nutrient intake into quintiles based on both methods. The proportions of correctly categorized subjects in the same or adjacent quintiles were calculated. Statistical analyses were performed using SAS procedures (18).
RESULTS
Reproducibility
The mean intake of all foods and nutrients, except for high-fat milk, buttermilk, and soft margarine, were generally higher when estimated using the second questionnaire than the first (table 1 and 2). The most conspicuous differences (>±25 percent) between the first and the second questionnaires among foods were for high-fat milk, soft drinks, vegetables, ice cream, and fish, and among nutrients, the largest difference was for ethanol. The intraclass correlation coefficients between questionnaires (table 1) ranged from 0.44 (ice cream) to 0.91 (coffee) for foods. The correlation coefficients were highest for the items consumed daily, such as coffee (0.91), low-fat milk (0.85), and butter (0.81) and lowest for rarely eaten foods such as ice cream (0.44), oils (0.54), and low-fat spreads (0.55) (table 1). The intraclass correlation coefficients for nutrients (table 2) ranged from 0.42 for ethanol to 0.72 for sucrose, riboflavin, and calcium. The average of all correlation coefficients for foods and nutrients was 0.65.
Reproducibility study: mean daily consumption of foods (g/day) on the basis of food frequency questionnaires and intraclass correlations* between questionnaires completed by 111 pregnant Finnish women, August 1995 to July 1996
| Food group | FFQ1† (mean (SD†)) | FFQ2† | FFQ1 + FFQ2 intraclass correlation coefficient | |
|---|---|---|---|---|
| Mean (SD) | % of FFQ1 | |||
| Rye products | 69 (48) | 78 (53) | 113 | 0.67 |
| Wheat products | 120 (46) | 130 (44) | 108 | 0.62 |
| Potatoes | 121 (52) | 138 (61) | 114 | 0.67 |
| Roots | 39 (34) | 43 (38) | 109 | 0.65 |
| Vegetables | 125 (76) | 165 (86) | 132 | 0.57 |
| Fruits | 252 (183) | 257 (203) | 102 | 0.72 |
| Fruit juices | 241 (209) | 299 (277) | 124 | 0.59 |
| Berries | 31 (26) | 38 (30) | 122 | 0.76 |
| Butter | 9.3 (8.4) | 10.2 (10.6) | 110 | 0.81 |
| Soft margarine | 13 (33) | 12 (29) | 92 | 0.68 |
| Low-fat spreads | 3.2 (10.6) | 3.2 (10.3) | 100 | 0.55 |
| Oils | 4.5 (2.4) | 5.2 (2.7) | 116 | 0.54 |
| High-fat milk | 22 (105) | 10 (72) | 47 | 0.60 |
| Low-fat milk | 461 (356) | 473 (334) | 103 | 0.85 |
| Buttermilk | 86 (148) | 66 (103) | 77 | 0.57 |
| Cream | 11 (6) | 13 (8) | 122 | 0.58 |
| Cheese | 60 (46) | 66 (45) | 111 | 0.71 |
| Ice cream | 12 (14) | 16 (20) | 131 | 0.44 |
| Pork | 44 (18) | 48 (20) | 109 | 0.56 |
| Beef | 16 (13) | 18 (11) | 111 | 0.60 |
| Poultry | 19 (20) | 19 (15) | 100 | 0.75 |
| Sausages | 28 (25) | 32 (22) | 112 | 0.62 |
| Inner organs | 4.0 (4.3) | 4.3 (4.5) | 108 | 0.71 |
| Fish | 19 (14) | 24 (18) | 130 | 0.64 |
| Eggs | 25 (12) | 28 (17) | 111 | 0.66 |
| Coffee | 208 (200) | 235 (211) | 113 | 0.91 |
| Tea | 106 (123) | 118 (132) | 111 | 0.77 |
| Soft drinks | 56 (87) | 74 (125) | 133 | 0.59 |
| Sweets | 21 (25) | 23 (23) | 109 | 0.64 |
Values log-transformed when necessary.
FFQ1, food frequency questionnaire 1; SD, standard deviation; FFQ2, food frequency questionnaire 2.
Reproducibility study: mean daily intakes of nutrients and other dietary factors on the basis of food frequency questionnaires and intraclass correlations* between questionnaires completed by 111 pregnant Finnish women, August 1995 to July 1996
| Dietary factor | FFQ1† (mean (SD†)) | FFQ2† | FFQ1 + FFQ2 intraclass correlation coefficient | |
|---|---|---|---|---|
| Mean (SD) | % of FFQ1 | |||
| Energy (kcal) | 2,517 (689) | 2,760 (697) | 110 | 0.66 |
| Protein (g) | 101 (27) | 109 (27) | 109 | 0.67 |
| Total carbohydrate (g) | 336 (89) | 370 (100) | 110 | 0.67 |
| Available carbohydrate (g) | 278 (72) | 306 (79) | 110 | 0.65 |
| Starch (g) | 132 (35) | 144 (40) | 109 | 0.62 |
| Sucrose (g) | 63 (28) | 73 (31) | 116 | 0.72 |
| Dietary fiber (g) | 27 (9) | 29 (10) | 110 | 0.66 |
| Water-soluble fiber (g) | 6.7 (2.5) | 7.2 (2.6) | 107 | 0.69 |
| Water-insoluble fiber (g) | 20 (7) | 22 (8) | 111 | 0.65 |
| Total fat (g) | 91 (37) | 100 (34) | 110 | 0.63 |
| Total triglycerides (g) | 81 (35) | 89 (31) | 109 | 0.63 |
| Saturated fatty acids (g) | 37 (14) | 41 (14) | 111 | 0.65 |
| Monounsaturated fatty acids (g) | 27 (12) | 29 (11) | 110 | 0.62 |
| Polyunsaturated fatty acids (g) | 12 (8) | 13 (7) | 108 | 0.65 |
| Total n-3 fatty acids (g) | 2.2 (1.2) | 2.4 (1.1) | 109 | 0.62 |
| Total n-6 fatty acids (g) | 11 (11) | 12 (9) | 109 | 0.67 |
| Ethanol (g) | 0.4 (0.9) | 0.7 (2.4) | 175 | 0.42 |
| Vitamin A (RE†, μg) | 1,548 (795) | 1,705 (814) | 110 | 0.69 |
| Total retinol (μg) | 876 (670) | 948 (604) | 108 | 0.70 |
| Carotenoids (μg) | 6,998 (3,643) | 8,334 (4,146) | 119 | 0.62 |
| β-Carotene (μg) | 3,848 (2,747) | 4,365 (2,973) | 113 | 0.64 |
| Vitamin D (μg) | 4.2 (2.7) | 4.6 (2.5) | 110 | 0.62 |
| Vitamin E (mg) | 12 (6) | 13 (5) | 108 | 0.63 |
| Thiamin (mg) | 2.1 (0.7) | 2.3 (0.6) | 110 | 0.63 |
| Riboflavin (mg) | 2.6 (0.8) | 2.8 (0.8) | 108 | 0.72 |
| Niacin (mg) | 37 (9) | 41 (10) | 110 | 0.64 |
| Folate (μg) | 386 (114) | 435 (118) | 113 | 0.64 |
| Vitamin B12 (μg) | 8.0 (3.2) | 8.7 (3.0) | 109 | 0.69 |
| Biotin (μg) | 44 (12) | 48 (13) | 109 | 0.67 |
| Pyridoxine (mg) | 2.5 (0.6) | 2.8 (0.7) | 112 | 0.65 |
| Pantothenic acid (μg) | 7.9 (2.0) | 8.7 (2.1) | 110 | 0.68 |
| Vitamin C (mg) | 220 (109) | 245 (124) | 112 | 0.66 |
| Calcium (mg) | 1,710 (654) | 1,812 (632) | 106 | 0.72 |
| Potassium (g) | 5.0 (1.3) | 5.5 (1.4) | 110 | 0.70 |
| Copper (mg) | 2.1 (0.7) | 2.3 (0.7) | 110 | 0.56 |
| Iron (mg) | 16 (4) | 17 (5) | 111 | 0.64 |
| Magnesium (mg) | 459 (116) | 503 (129) | 110 | 0.68 |
| Sodium (mg) | 3,954 (1,011) | 4,374 (1,105) | 111 | 0.66 |
| Zinc (mg) | 15 (4) | 17 (4) | 110 | 0.66 |
| Manganese (mg) | 7.0 (2.3) | 7.8 (2.6) | 111 | 0.63 |
| Iodine (μg) | 345 (93) | 377 (100) | 109 | 0.71 |
| Selenium (μg) | 70 (18) | 77 (19) | 109 | 0.63 |
| Chromium (μg) | 34 (10) | 38 (11) | 112 | 0.64 |
| Mercury (μg) | 5.4 (2.2) | 6.5 (2.6) | 120 | 0.65 |
| Lead (μg) | 32 (12) | 36 (15) | 112 | 0.59 |
| Nitrate (mg) | 82 (42) | 96 (44) | 117 | 0.71 |
| Nitrite (mg) | 1.7 (0.8) | 1.9 (0.8) | 112 | 0.65 |
Values log-transformed when necessary.
FFQ1, food frequency questionnaire 1; SD, standard deviation; FFQ2, food frequency questionnaire 2; RE, retinol equivalent.
Validity
Food consumption was more likely to be overestimated than underestimated by the questionnaires; the estimates from the questionnaires were approximately 134 percent (first questionnaire, data not shown) and 129 percent (second questionnaire) of the values of the food records (table 3). The most marked overestimates (questionnaire ≥160 percent of food record) were for pork, soft margarine, fruit juices, inner organs, low-fat spreads, and vegetables. The most striking underestimate was for soft drinks. The mean nutrient intakes assessed using the FFQs were 138 (first questionnaire, data not shown) and 136 percent (second questionnaire) of the values, based on the means of 10-day food records (table 4). The most marked overestimates (questionnaire ≥160 percent of food record) were observed for thiamin and nitrate.
Validation study: mean daily intakes of foods based on food records and food frequency questionnaires: Pearson correlation coefficients* between daily consumption of foods, on the basis of food frequency questionnaires and food records completed by 113 pregnant Finnish women, August 1995 to July 1996
| Food group | Food record (mean (SD†)) | FFQ† (% of food records) | Pearson correlation coefficients between FFQ and food record | ||
|---|---|---|---|---|---|
| Unadjusted‡ | Energy adjusted | Attenuation and energy adjusted | |||
| Rye products | 50 (30) | 125 | 0.57 | 0.55 | 0.59 |
| Wheat products | 105 (38) | 122 | 0.47 | 0.44 | 0.52 |
| Potatoes | 91 (42) | 145 | 0.41 | 0.49 | 0.59 |
| Roots | 36 (31) | 144 | 0.51 | 0.57 | 0.64 |
| Vegetables | 102 (90) | 164 | 0.61 | 0.58 | 0.60 |
| Fruits | 212 (140) | 116 | 0.55 | 0.47 | 0.50 |
| Fruit juices | 113 (113) | 168 | 0.62 | 0.73 | 0.78 |
| Berries | 42 (37) | 94 | 0.52 | 0.59 | 0.68 |
| Butter | 11 (10) | 95 | 0.48 | 0.73 | 0.77 |
| Soft margarine | 8.3 (8) | 184 | 0.61 | 0.60 | 0.64 |
| Low-fat spreads | 4.6 (7.2) | 166 | 0.42 | 0.24 | 0.25 |
| Oils | 4.1 (2.3) | 133 | 0.14 | 0.18 | 0.22 |
| High-fat milk | 6.9 (19) | 124 | 0.01 | 0.03 | 0.04 |
| Low-fat milk | 399 (301) | 125 | 0.81 | 0.84 | 0.86 |
| Buttermilk | 47 (70) | 138 | 0.41 | 0.48 | 0.52 |
| Cream | 11 (10) | 109 | 0.09 | 0.16 | 0.19 |
| Cheese | 51 (28) | 120 | 0.56 | 0.56 | 0.61 |
| Ice cream | 15 (19) | 101 | 0.37 | 0.50 | 0.58 |
| Pork | 25 (16) | 188 | 0.45 | 0.30 | 0.38 |
| Beef | 20 (21) | 114 | 0.35 | 0.27 | 0.33 |
| Poultry | 14 (18) | 147 | 0.24 | 0.28 | 0.37 |
| Sausages | 35 (24) | 111 | 0.77 | 0.62 | 0.72 |
| Inner organs | 2.5 (5.9) | 167 | 0.34 | 0.29 | 0.36 |
| Fish | 16 (17) | 148 | 0.44 | 0.37 | 0.44 |
| Eggs | 21 (11) | 133 | 0.27 | 0.35 | 0.45 |
| Coffee | 199 (170) | 108 | 0.97 | 0.77 | 0.79 |
| Tea | 159 (186) | 88 | 0.71 | 0.78 | 0.80 |
| Soft drinks | 72 (102) | 83 | 0.44 | 0.41 | 0.46 |
| Sugar and sweets | 45 (23) | 91 | 0.46 | 0.50 | 0.58 |
Based on log-transformed values.
SD, standard deviation; FFQ, food frequency questionnaire.
Ninety-five percent confidence intervals for the minimum (r = 0.01, 95% confidence interval: −017, 0.19) and maximum (r = 0.97, 95% confidence interval: 0.96, 0.98) values of correlation.
Validation study: mean daily intakes of nutrients based on food records and food frequency questionnaires: Pearson correlation coefficients* between daily intake of nutrients, on the basis of food frequency questionnaires and food records completed by 113 pregnant Finnish women, August 1995 to July 1996
| Dietary factor | Food record (mean (SD†)) | FFQ† (% of food records) | Correlation coefficients between FFQ and food record | ||
|---|---|---|---|---|---|
| Unadjusted‡ | Energy adjusted | Attenuation and energy adjusted | |||
| Energy (kcal) | 2,176 (420) | 125 | 0.24 | ||
| Protein (g) | 82 (17) | 133 | 0.26 | 0.50 | 0.55 |
| Total carbohydrate (g) | 286 (59) | 123 | 0.30 | 0.45 | 0.49 |
| Available carbohydrate (g) | 242 (51) | 121 | 0.35 | 0.44 | 0.47 |
| Starch (g) | 113 (26) | 124 | 0.50 | 0.39 | 0.44 |
| Sucrose (g) | 68 (25) | 101 | 0.41 | 0.50 | 0.53 |
| Dietary fiber (g) | 20 (6) | 146 | 0.48 | 0.56 | 0.59 |
| Water-soluble fiber (g) | 4.9 (1.4) | 145 | 0.41 | 0.55 | 0.58 |
| Water-insoluble fiber (g) | 15 (5) | 142 | 0.53 | 0.56 | 0.59 |
| Total fat (g) | 81 (20) | 127 | 0.28 | 0.44 | 0.48 |
| Total triglycerides (g) | 73 (19) | 125 | 0.27 | 0.39 | 0.64 |
| Saturated fatty acids (g) | 34 (10) | 119 | 0.34 | 0.51 | 0.55 |
| Monounsaturated fatty acids (g) | 24 (6) | 128 | 0.23 | 0.31 | 0.34 |
| Polyunsaturated fatty acids (g) | 10 (3) | 137 | 0.34 | 0.42 | 0.47 |
| Total n-3 fatty acids (g) | 1.9 (0.6) | 137 | 0.30 | 0.34 | 0.39 |
| Total n-6 fatty acids (g) | 8.7 (3) | 153 | 0.42 | 0.45 | 0.49 |
| Ethanol (g) | 0.3 (0.7) | 100 | 0.42 | 0.37 | 0.45 |
| Vitamin A (RE†, μg) | 1,229 (909) | 150 | 0.44 | 0.30 | 0.37 |
| Total retinol (μg) | 692 (839) | 143 | 0.64 | 0.68 | 0.71 |
| Carotenoids (μg) | 5,906 (4,624) | 154 | 0.61 | 0.58 | 0.62 |
| β-Carotene (μg) | 3,119 (2,632) | 157 | 0.41 | 0.44 | 0.53 |
| Vitamin D (μg) | 3.6 (2.2) | 144 | 0.32 | 0.39 | 0.44 |
| Vitamin E (mg) | 9.7 (2.4) | 139 | 0.19 | 0.19 | 0.22 |
| Thiamin (mg) | 1.3 (0.3) | 169 | 0.49 | 0.70 | 0.74 |
| Riboflavin (mg) | 2.1 (0.6) | 133 | 0.23 | 0.50 | 0.57 |
| Niacin (mg) | 31 (6) | 132 | 0.33 | 0.55 | 0.60 |
| Folate (μg) | 309 (65) | 134 | 0.32 | 0.39 | 0.48 |
| Vitamin B12 (μg) | 6.5 (2.7) | 137 | 0.23 | 0.33 | 0.38 |
| Biotin (μg) | 36 (9) | 133 | 0.37 | 0.46 | 0.50 |
| Pyridoxine (mg) | 2.0 (0.5) | 135 | 0.33 | 0.61 | 0.66 |
| Pantothenic acid (μg) | 6.1 (1.3) | 138 | 0.47 | 0.57 | 0.60 |
| Vitamin C (mg) | 153 (67) | 144 | 0.47 | 0.61 | 0.65 |
| Calcium (mg) | 1,377 (405) | 131 | 0.36 | 0.49 | 0.58 |
| Copper (mg) | 1.6 (0.4) | 138 | 0.31 | 0.28 | 0.32 |
| Iron (mg) | 12 (4) | 144 | 0.30 | 0.56 | 0.60 |
| Magnesium (mg) | 348 (71) | 140 | 0.21 | 0.39 | 0.44 |
| Sodium (mg) | 3,325 (676) | 129 | 0.35 | 0.54 | 0.59 |
| Zinc (mg) | 12 (3) | 136 | 0.44 | 0.42 | 0.45 |
| Manganese (mg) | 5.5 (2.2) | 136 | 0.36 | 0.47 | 0.52 |
| Iodine (μg) | 297 (10) | 125 | 0.24 | 0.44 | 0.51 |
| Selenium (μg) | 58 (13) | 132 | 0.13 | 0.40 | 0.46 |
| Chromium (μg) | 27 (7) | 130 | 0.36 | 0.39 | 0.47 |
| Mercury (μg) | 4.9 (3.1) | 136 | 0.44 | 0.56 | 0.61 |
| Lead (μg) | 22 (7) | 148 | 0.60 | 0.67 | 0.79 |
| Nitrate (mg) | 60 (34) | 165 | 0.57 | 0.59 | 0.63 |
| Nitrite (mg) | 1.6 (0.8) | 119 | 0.60 | 0.67 | 0.79 |
Based on log-transformed values.
SD, standard deviation; FFQ, food frequency questionnaire; RE, retinol equivalent.
Ninety-five percent confidence intervals for the minimum (r = 0.13, 95% confidence interval: −0.06, 0.31) and maximum (r = 0.64, 95% confidence interval: 0.52, 0.74) values of correlation.
The unadjusted Pearson correlation coefficients for foods (table 3) ranged from 0.01 for high-fat milk to 0.97 for coffee. The correlations for foods were stronger than those for nutrients (mean, 0.48 vs. 0.38 (first questionnaire, data not shown) and 0.47 vs. 0.37 (second questionnaire)) and tended to be stronger for foods consumed with higher frequency. Adjustment for energy led to the most conspicuous changes for the intake of butter, sausages, and pork and the correction for attenuation for the consumption of eggs, potatoes, sausages, and berries. The adjusted and corrected correlation coefficients then ranged from 0.04 to 0.86.
The average correlation coefficient for nutrients was 0.37 (table 4). The energy-adjusted Pearson correlation coefficients for nutrients varied from 0.19 to 0.70. The most notable changes compared with the unadjusted values were observed for pantothenic acid, niacin, and chromium. When the effect of attenuation was taken into account, the coefficients ranged from 0.22 to 0.74. According to the improvement in the correlation coefficient, when attenuation was taken into account, the subjects had the greatest within-person variation in the intakes of total triglycerides, vitamin D, mercury, nitrite, copper, and vitamin B12.
Classification
The subjects were divided into quintiles by food consumption (table 5) and nutrient intake (energy-adjusted estimates) (table 6) as measured by using FFQs and food records.
Validation study: cross-classification of food consumption quintiles* from food records and the food frequency questionnaires completed by 113 pregnant Finnish women, August 1995 to July 1996
| Food group | Lowest quintile on food records | Overall proportion categorized in the same or adjacent quintile of food record (%) | ||
|---|---|---|---|---|
| Lowest quintile on FFQ† (%) | Lowest two quintiles on FFQ (%) | Highest quintile on FFQ (%) | ||
| Rye products | 50 | 64 | 5 | 68 |
| Wheat products | 55 | 64 | 5 | 65 |
| Potatoes | 41 | 77 | 0 | 73 |
| Roots | 50 | 68 | 0 | 81 |
| Vegetables | 50 | 68 | 0 | 71 |
| Fruits | 59 | 77 | 5 | 73 |
| Fruit juices | 59 | 86 | 0 | 86 |
| Berries | 45 | 82 | 5 | 74 |
| Butter | 36 | 55 | 9 | 66 |
| Soft margarine | 41 | 77 | 0 | 76 |
| Low-fat spreads | 45 | 73 | 0 | 73 |
| Oils | 36 | 59 | 14 | 54 |
| High-fat milk | 14 | 36 | 23 | 58 |
| Low-fat milk | 68 | 100 | 0 | 92 |
| Buttermilk | 36 | 64 | 5 | 76 |
| Cream | 32 | 50 | 14 | 60 |
| Cheese | 55 | 82 | 5 | 75 |
| Ice cream | 41 | 68 | 5 | 71 |
| Pork | 55 | 64 | 9 | 63 |
| Beef | 32 | 59 | 0 | 64 |
| Poultry | 32 | 55 | 9 | 59 |
| Sausages | 27 | 63 | 0 | 72 |
| Inner organs | 36 | 41 | 18 | 57 |
| Fish | 36 | 68 | 9 | 69 |
| Eggs | 32 | 45 | 14 | 62 |
| Coffee | 100 | 0 | 0 | 94 |
| Tea | 64 | 77 | 5 | 87 |
| Alcoholic drinks | 18 | 32 | 14 | 52 |
| Soft drinks | 50 | 64 | 9 | 75 |
| Sugar and sweets | 32 | 59 | 9 | 63 |
Calculated from energy-adjusted food consumption.
FFQ, food frequency questionnaire.
| Nutrient | Lowest quintile on food records | Overall proportion categorized in the same or an adjacent quintile of food record quintile (%) | ||
|---|---|---|---|---|
| Lowest quintile on FFQ† (%) | Lowest two quintiles on FFQ (%) | Highest quintile on FFQ (%) | ||
| Energy | 41 | 59 | 0 | 60 |
| Protein | 32 | 55 | 5 | 69 |
| Total carbohydrates | 41 | 59 | 9 | 70 |
| Available carbohydrates | 36 | 55 | 9 | 60 |
| Starch | 27 | 64 | 0 | 68 |
| Sucrose | 50 | 73 | 5 | 72 |
| Dietary fiber | 50 | 82 | 9 | 72 |
| Water-soluble fiber | 55 | 73 | 14 | 73 |
| Water-insoluble fiber | 55 | 77 | 5 | 74 |
| Total fat | 41 | 64 | 0 | 66 |
| Total triglycerides | 45 | 68 | 5 | 67 |
| Saturated fatty acids | 45 | 77 | 5 | 75 |
| Monounsaturated fatty acids | 36 | 50 | 9 | 58 |
| Polyunsaturated fatty acids | 27 | 59 | 0 | 64 |
| Total n-3 fatty acids | 41 | 59 | 9 | 62 |
| Total n-6 fatty acids | 32 | 55 | 0 | 64 |
| Ethanol | 55 | 64 | 0 | 66 |
| Vitamin A | 41 | 64 | 0 | 70 |
| Total retinol | 41 | 59 | 5 | 68 |
| Carotenoids | 64 | 86 | 5 | 76 |
| β-Carotene | 59 | 73 | 5 | 77 |
| Vitamin D | 36 | 59 | 9 | 63 |
| Vitamin E | 36 | 68 | 5 | 65 |
| Thiamin | 27 | 63 | 18 | 70 |
| Riboflavin | 50 | 73 | 5 | 81 |
| Niacin | 23 | 55 | 5 | 64 |
| Folate | 27 | 63 | 0 | 69 |
| Vitamin B12 | 23 | 45 | 14 | 72 |
| Biotin | 50 | 82 | 5 | 72 |
| Pyridoxine | 50 | 82 | 0 | 74 |
| Pantothenic acid | 45 | 77 | 5 | 74 |
| Vitamin C | 64 | 82 | 5 | 74 |
| Potassium | 55 | 68 | 5 | 59 |
| Calcium | 41 | 64 | 5 | 75 |
| Copper | 41 | 68 | 0 | 71 |
| Iron | 41 | 59 | 0 | 65 |
| Magnesium | 50 | 77 | 9 | 76 |
| Sodium | 23 | 55 | 9 | 65 |
| Zinc | 41 | 68 | 5 | 73 |
| Manganese | 41 | 73 | 0 | 66 |
| Iodine | 55 | 73 | 5 | 65 |
| Selenium | 14 | 50 | 0 | 62 |
| Chromium | 55 | 73 | 14 | 67 |
| Mercury | 64 | 73 | 0 | 68 |
| Lead | 55 | 77 | 5 | 78 |
| Nitrite | 45 | 77 | 0 | 73 |
| Nitrate | 55 | 82 | 5 | 80 |
Calculated from energy-adjusted intakes.
FFQ, food frequency questionnaire.
An average of 70 percent (52–94 percent) of the women were classified by both methods into the same or adjacent quintiles according to their food intake, and an average of 69 percent (58–81 percent) were classified as such according to nutrient intakes. For foods, only five of 30 proportions remained under 60 percent, and for the nutrients, only two of 47 proportions did so. The greatest misclassifications (>15 percent in the highest quintile on questionnaires and in the lowest quintile on food records) were found for high-fat milk (23 percent) and inner organs (18 percent) in food groups and for thiamin (18 percent) among nutrients. On average, 6 percent of foods and 5 percent of nutrients were grossly misclassified into extreme quintiles.
DISCUSSION
To effectively study the putative effects of the maternal diet during pregnancy on the development of type 1 diabetes in the offspring, we needed a dietary instrument that could be administered after delivery when the genetic disease susceptibility of the offspring had already been determined. We developed a 181-item FFQ that was sufficiently accurate for measuring the diet of the mother during the third trimester of pregnancy. In the validation study, the correlation coefficients between the second questionnaire, completed 1 month after delivery (the same arrangement as in the study proper), and the food records were similar to those obtained between the first questionnaire, completed during the period of interest (eighth month of pregnancy), and the food records. As in most other validation studies, the FFQ overestimated food consumption and intakes of nutrients. The quintile notation was acceptable for most of the foods and nutrients of special interest. The questionnaire also showed a good degree of reproducibility. The sample size of 113 subjects is reasonable for a validation study (8). The subjects came from the population for which the questionnaire was designed. In the validation study, the follow-up rate was 80 percent, which is rather high, since keeping food records for 10 days and completing a relatively cumbersome questionnaire twice requires motivation.
In reproducibility studies, the correlation coefficients have generally ranged from 0.5 to 0.7 for nutrient intakes (8). Our results compare well with those findings, except for ethanol. Moreover, in the Finnish study of nonpregnant women (12), the intraclass correlation for alcohol was weaker than in other reports. Intraclass correlations from our questionnaire for food items had greater variability than did those for nutrients, which is consistent with the results of earlier surveys (8). In the validation study, in which the subjects also completed the questionnaire twice, the mean intra-class correlation for nutrients was similar to that in our reproducibility study.
The absolute intakes estimated by using questionnaires were 30–40 percent higher than the food record estimates. When we compared our results with those of a Finnish validation study among nonpregnant women (12), it seemed that with the FFQ pregnant women tended to overestimate their food consumption more than nonpregnant women did. Earlier validation studies among pregnant women have reported similar overestimates using FFQs compared with food records or 24-hour recalls (3, 56–7). Only in one survey (4) were contradictory results reported.
Overestimation may reflect difficulties in comparing the standard portion size offered with the portion that is actually consumed. The use of an FFQ both before and after the food record provided minimal and maximal estimates of true validity; the process of keeping a food record might have improved the accuracy in completing the latter questionnaire. However, according to the intraclass correlations between foods and nutrients in the first and the second questionnaires (data not shown), the effect, if any, of increased awareness was minimal. The results of earlier studies have shown the difficulty of measuring fruit and vegetable consumption accurately using FFQs (1920–21). Our questionnaire overestimated vegetables and fruit juices, but not fruits, relatively more than other foods. Overestimation is not necessarily problematic in epidemiologic studies if the ranking of the persons according to their dietary intake is valid (22).
The crude correlations were, in general, higher for foods than for nutrients. The energy-adjustment method and correction for attenuation were used to avoid misleading conclusions on differences in the total energy intake between subjects and random within-person variation. Energy adjustment did not markedly improve the correlations for foods, but did strengthen the correlations for nutrients to a level similar to that observed for foods. In validation studies, correlation coefficients lower than 0.4 will attenuate associations between exposure and outcome to a significant degree (8, 23). After energy adjustment and correction for attenuation, the correlation coefficients of six nutrients and eight foods were lower than 0.4. Most of those foods were not consumed frequently, and therefore, their consumption appears to be difficult to measure using an FFQ. We also recorded weak correlations for various meats, which might reflect difficulties in recognizing and grouping meat categories.
We calculated quintiles by using energy-adjusted variables, since we plan to use energy-adjusted dietary intakes as exposure measures in the study proper. Comparisons of quintiles are more informative than a correlation coefficient when reporting the capacity of an assessment method to rank persons in relation to their intake (24). In our study proper, we will take a special interest in milk and cereal products among the foods and in total protein, antioxidative vitamins, and minerals among the nutrients, and in nitrates, nitrites, and heavy metal contaminants (25, 2626). It appears that by using our FFQ, we will be able to rank subjects according to their intake of the foods and nutrients listed above. Furthermore, our questionnaire provided accurate estimates for a large range of other foods and nutrients.
The assessment of the dietary intake of pregnant women is complicated because of various factors depending on the period of pregnancy. Poor correlation between instruments may be partly explained by appetite fluctuations and nausea, which may also influence the long-term diet reports (27). Five other validation studies with pregnant women have been performed during the last decade (3–7). They are difficult to compare with our study and with each other since they cover various periods of pregnancy and differ in the reference method used and in the number of days of dietary recording. Robinson et al. (3) and Brown et al. (44) used the food record as a reference method, whereas the 24-hour recall was used in the others (5–7). The studies have calculated only the intakes of nutrients, except for the study of Robinson et al., in which the contribution of selected food groups to energy and energy-yielding nutrients was also assessed. There are also statistical differences between the studies. Besides having a larger selection of nutrients, our questionnaire provides new information about the validity of the questionnaire for measuring food consumption and intakes of some food additives and contaminants during pregnancy. In general, our correlations for nutrients seem to be comparable with the results of other validation studies of pregnant women, which range from −0.02 to 0.55 for energy-adjusted nutrients (3–7). Questions about the frequency of eating out and about personal choices for fats used in cooking are among the strengths of our FFQ compared with most of the others (2323).
The reproducibility and relative validity of the FFQ assessed in this study were comparable with the results of earlier studies. We conclude that our questionnaire is a reasonably good method for assessing the diet of pregnant women in a prospective study focusing on the development and determinants of type 1 diabetes.
Correspondence to Dr. Suvi M. Virtanen, School of Public Health, FIN-33014 University of Tampere, Tampere, Finland (e-mail: suvi.m.virtanen@uta.fi).
Supported by the Finnish Academy of Sciences, the Finnish Diabetes Research Foundation, and the Yrjö Jahnsson Foundation.
The authors thank Anne Nyberg for data entry, Mikko Virtanen and Heli Tapanainen for statistical guidance, and Catarina Ståhle-Nieminen and Jonathan Robinson for language editing.
REFERENCES
Barker DJP, Gluckman PD, Robinson JS. Fetal origins of adult disease. Report of the First International Study Group, Sydney, Australia, October 29–30, 1994. Placenta 1995;16:317–20.
Lindberg B, Ivarsson S-A, Landin-Olsson M, et al. Islet autoantibodies in cord blood from children who developed type 1 (insulin-dependent) diabetes mellitus before 15 years of age.
Robinson S, Godfrey K, Osmond C, et al. Evaluation of a food frequency questionnaire used to assess nutrient intakes in pregnant women.
Brown JE, Buzzard IM, Jacobs DR, et al. A food frequency questionnaire can detect pregnancy-related changes in diet.
Forsythe HE, Gage B. Use of a multicultural food-frequency questionnaire with pregnant and lactating women.
Greeley S, Storbakken L, Magel R. Use of a modified food frequency questionnaire during pregnancy.
Suitor CJW, Gardner J, Willett WC. A comparison of food frequency and diet recall methods in studies of nutrient intake of low-income pregnant women.
Meriläinen J, Gissler M, Hemminki E, et al. Perinatal statistics 1993. Tilastotiedote 18, 1995. (In Finnish). Helsinki, Finland: Sosiaali-ja terveysalan tutkimus-ja kehittämiskeskus, 1995.
Pietinen P, Hartman AM, Haapa E, et al. Reproducibility and validity of dietary assessment instruments. I. A self-administered food use questionnaire with a portion size picture booklet.
Pietinen P, Hartman AM, Haapa E, et al. Reproducibility and validity of dietary assessment instruments. II. A qualitative food frequency questionnaire.
Männistö S, Virtanen M, Mikkonen T, et al. Reproducibility and validity of a food frequency questionnaire in a case-control study on breast cancer.
Kleemola P, Virtanen M, Pietinen P. The 1992 dietary survey of Finnish adults. Publication B2. Helsinki, Finland: National Public Health Institute, 1994.
Leino U. Ruokamittoja. Publication B1. (In Finnish). Helsinki, Finland: National Public Health Institute,1984.
Haapa E, Toponen T, Pietinen P, et al. Food portion pictures. (In Finnish). Helsinki, Finland: The National Public Health Institute and Department of Nutrition, University of Helsinki, 1985.
Ovaskainen M-L, Valsta LM, Lauronen J. The compilation of food analysis values as a database for dietary studies--the Finnish experience.
Margetts BM, Nelson M. Design concepts in nutritional epidemiology. New York, NY: Oxford University Press, 1991.
Smith-Warner SA, Elmer PJ, Fosdick L, et al. Reliability and comparability of three dietary assessment methods for estimating fruit and vegetable intake.
Calvert C, Cade J, Barrett JH, et al. Using cross-check questions to address the problem of mis-reporting of specific food groups on food frequency questionnaires.
Krebs-Smith SM, Heimendinger J, Subar AF, et al. Using food frequency questionnaire to estimate fruit and vegetable intake: association between the number of questions and total intakes.
Beaton GH. Interpretation of results from diet history studies. In: Kohlmeier L, ed. The diet history method. London, England: Smith-Gordon, 1991.
Sempos CT. Invited commentary: Some limitations of semiquantitative food frequency questionnaires.
Garrow JS. Validation of methods for estimating habitual diet: proposed guidelines.
Åkerblom HK, Knip M. Putative environmental factors in type 1 diabetes.

