


Abstract
Interventionists commonly identify promising messages for health communication efforts based on audience members’ ratings of perceived message effectiveness (PME).
We sought to validate a new PME measure that improved on existing scales by focusing on the behavior and respondent, being brief, and having strong psychometric properties.
Participants were a national convenience sample of 999 adults and national probability samples of 1,692 adults and 869 adolescents recruited in 2015. Smokers and nonsmokers rated up to six brief messages about the chemicals in cigarette smoke on two PME scales. The first was the new three-item University of North Carolina (UNC) PME Scale that assessed effects perceptions. The second was an established six-item PME scale that assessed message perceptions. We examined the UNC PME Scale’s psychometric properties and compared both scales using item factor analysis.
The UNC PME Scale measured the same construct across multiple chemical messages (all factor loadings ≥ 0.86). It exhibited high reliability (>0.85) over very low to moderate levels of PME (z = −2.5 to 0.2), a range that is useful for identifying more promising messages. Samples of adults and adolescents showed a similar pattern of results. As expected, the UNC PME Scale was strongly positively correlated with message perceptions (r = .84). It also exhibited strong psychometric properties among participants regardless of education, reactance, sex, and smoking status.
The UNC PME Scale reliably and validly measured PME among adults and adolescents from diverse groups. This brief scale may be used to efficiently evaluate candidate antismoking messages and may be suitable for adaptation to other health risk behaviors.
Perceived message effectiveness (PME) is concerned with the perception that candidate messages will or will not achieve their objectives. Use of PME as a tool for message selection has become increasingly common in the last two decades [1]. Many researchers now use PME as an early indicator of a health message’s potential to change behavior. There is growing evidence for the predictive validity of PME, with a small number of longitudinal studies demonstrating that PME predicts changes in smoking behavior in the context of antismoking messages [2, 3]. A comparatively larger number of cross-sectional studies show that PME is associated with attitudes [4] and behavioral intentions in a variety of health messaging contexts, including those seeking to promote colonoscopy [5], improving social support outcomes [6], and preventing sexually transmitted infections [7].
PME measures have traditionally used two related constructs [1]. The first construct is message perceptions, also called attribute or ad-directed PME. These are judgments about whether a message will promote further processing that leads to persuasion [8]. Dimensions of message perceptions include credibility (e.g., “How believable was the message in this ad?”) [9] and understandability (e.g., “This ad was easy to understand”) [10]. Message perceptions are rooted in communication theories of persuasion, such as the Elaboration Likelihood Model, which posit message characteristics such as argument quality function as a gateway to greater elaboration and thereby attitude change [11–13].
The second construct is effects perceptions, also called impact or personalized PME. These are judgments about a message’s potential to change important antecedents of behavior or behavior itself. Dimensions of effects perceptions include perceived impact on self-efficacy (e.g., “Watching this ad helped me feel confident about how to best deal with smoking”) [14] and perceived impact on behavioral motivation (“This ad makes me want to quit smoking”) [15]. Effects perceptions are rooted in behavioral scientific research suggesting that briefly viewed messages elicit affective reactions that add meaning to the messages [16–18]. A typical use of effects perceptions is to predict changes in behavior among the target audience in response to health communication. As a result, effects perception items use behavioral and personal referents that direct respondents to consider the effects of messages on their own attitudes, beliefs, thoughts, or behaviors [1].
Although message and effects perceptions are conceptually distinct, many researchers use the terms interchangeably or combine them when measuring PME [1, 19, 20]. As a result, critics have called the current measurement of PME [1, 4] as inadequate [20] and questioned the meaningfulness and utility of PME judgments in message development altogether [21, 22]. Given that many health messages aim to change behavior and effect perceptions are conceptually proximal to behavior, PME scales with a clear effects orientation are a promising direction for the literature. Additional concerns about the measurement of PME are that existing scales are either lengthy or too generic and do not uniformly use behavioral or personal referents in their items. Both practices may increase measurement error and cognitive burden. High cognitive burden may also limit the number of messages that respondents can evaluate in a single study.
To address issues in the current measurement of PME, we developed the University of North Carolina (UNC) PME Scale, conceptualizing PME as the extent to which a person believes that a health message will affect them in ways that are consistent with message objectives, particularly changing behavior [20]. The UNC PME Scale has only three items that uniformly focus on behavior and the respondent. We sought to examine this new scale’s psychometric properties in the context of brief messages about the chemicals in cigarette smoke that were designed to discourage smoking. Previous applications of the UNC PME Scale have shown that it is sensitive to different characteristics of chemical messages that may influence the extent to which messages discourage smoking (e.g., familiarity with referenced chemical [23, 24], verbal features and number of referenced chemicals [23, 24], and type and combinations of contextual information provided [24–26]). Three main goals for the use of PME guided our study. First, the UNC PME Scale should measure the same construct across different messages so that researchers can meaningfully compare individual messages using PME ratings. Second, it should function similarly among diverse populations so that researchers can compare messages among subgroups of interest. Finally, unlike many PME measures used in the literature [1, 20], it should demonstrate construct validity with other variables that may influence health message impact, such as message reactance [27, 28] and credibility [29, 30].
Methods
Participants
Participants were two samples of adults and one sample of adolescents recruited in 2015. We recruited a convenience sample of U.S. adults (age ≥ 18; n = 1,034) using Amazon Mechanical Turk, an online marketplace that provides efficient access to study participants [31, 32]. In addition, the Carolina Survey Research Laboratory invited all 13–25-year-olds, all smokers, and a randomly selected subset of adult (age ≥ 25) nonsmokers, who had previously completed a tobacco-related phone survey to participate in an online follow-up survey [23, 33]. Data collection was multimodal (desktop computers, mobile devices, and by mail), with nonresponders being contacted up to three times through telephone reminder calls and priority mailings. The follow-up survey had an overall response rate of 73% (2,637/3,612). We treated the data from adults (18+; n = 1,758) and adolescents (13–17; n = 877) as separate probability samples. After eliminating participants with missing data on the UNC PME Scale, construct validators, or demographic characteristics, the three analytic samples had 999 (adult convenience), 1,692 (adult probability), and 869 (adolescent probability) participants
Procedures
In a repeated-measures design, participants in the adult convenience sample rated two chemical messages. Those in the probability samples rated six chemical messages in one of five randomly assigned orders. The messages varied by chemical and associated contextual information (Table 1). We developed the messages through multiple rounds of formative studies [23–26], selecting the most promising ones from a library of 76 chemical messages [24]. Adult convenience participants received $3 while adult and adolescent probability participants received $45 for completing their respective surveys, which were much longer. The Institutional Review Board at the UNC approved the procedures for all three samples.
Messages about the chemicals in cigarette smoke
| Label | Chemical message | Adult convenience sample | Adult probability sample | Adolescent probability sample |
|---|---|---|---|---|
| AM | Cigarette smoke contains ammonia. This is used as a pesticide and causes breathing problems. | ✓ | ✓ | |
| AR1 | Cigarette smoke contains arsenic. This is found in rat poison and causes heart damage. | ✓ | ✓ | ✓ |
| AR2 | Cigarette smoke contains arsenic. This causes lung tumors. | ✓ | ✓ | |
| FO | Cigarette smoke contains formaldehyde. This causes throat cancer. | ✓ | ✓ | ✓ |
| LE | Cigarette smoke contains lead. This causes cancer and brain disorders. | ✓ | ✓ | |
| UR | Cigarette smoke contains uranium. This causes lung tumors and kidney damage. | ✓ | ✓ |
Measures
UNC PME Scale
In the adult convenience study mentioned above, we developed 12 candidate items to assess various perceptions of chemical messages designed to discourage smoking. We worded the items such that they could be answered by both smokers and nonsmokers. The five-point response scale for all items ranged from “strongly disagree” to “strongly agree” (coded as 1–5). Exploratory factor analysis using maximum likelihood estimation and promax rotation revealed a four-factor solution of effects perceptions, message perceptions, message reactance [28], and message credibility.
The factor for effects perceptions had four items that assessed respondents’ perceptions of discouragement, concern, unpleasantness, and appeal as related to the contents of the chemical messages. These four perceptions are antecedents to behavior change in the Message Impact Framework [34] and UNC Tobacco Warnings Model [35]. The discouragement item, “This message discourages me from wanting to smoke,” came from our previous work on cigarette warnings and is theoretically derived from work on behavioral intentions [36, 37]. The concern item, “This message makes me concerned about the health effects of smoking,” was focused on the health consequences of smoking, and is derived from work on affect and risk perception [38]. The unpleasantness item, “This message makes smoking seem unpleasant to me,” and the appeal item, “This message makes smoking seem less appealing to me,” [24] were focused on reduced pleasure from smoking and are derived from work on smoking expectancies [39]. Due to the overlap between these last two items (r = .84) and cognitive testing revealing greater clarity in the unpleasantness item, we dropped the appeal item yielding the three-item UNC PME Scale (α = .93). For clarity, we generally refer to the UNC PME Scale as our effects perceptions scale in the remainder of this article to emphasize the conceptual difference between it and message perceptions.
Other measures
To support analyses of construct validity, we assessed message perceptions, message reactance, and message credibility for each chemical message. The established six-item message perceptions scale (assessed in adult convenience sample only) references the respondent in one item only (i.e., “This message grabbed my attention”), and the scale does not use behavioral referents at all [40]. We measured message reactance, or resistance to the message, using the Brief Reactance to Health Warnings Scale (all samples) [28]. Finally, we measured message credibility (adult convenience sample only) using two items, “This message is believable to me,” and “This message seems credible to me.” The five-point response scale for all items ranged from “strongly disagree” to “strongly agree” (coded as 1–5). We predicted that our effect perceptions scale would correlate positively with the message perceptions scale and message credibility but would be negatively correlated with message reactance.
The survey also assessed smoking status and standard demographic variables. Adult smokers were those individuals who had smoked at least 100 cigarettes in their lifetime and currently smoke every day or some days [41], and adolescent ever smokers were those who had ever tried smoking cigarettes, even one or two puffs [42].
Data Analysis
Analyses used R (ver. 3.4.3) [43] with three selected add-on packages, lavaan (ver. 0.5–23.1097) [44] and mirt (ver. 1.27.1) [45] for estimating psychometric models and ggplot2 (ver. 2.2.1) [46] for plotting related mathematical functions.
Psychometric properties
To parse variability in the items on our effects perceptions scale that is inherent to PME from variability that is specific to chemical messages, we used a two-tier item bifactor analytic (IFA) model with a general factor for PME spanning all chemical messages and orthogonal message-specific factors [47]. We compared the loadings on and variance accounted for by the general factor with those for the message-specific factors to determine the extent to which the scale may function differently in the context of specific chemical messages [48]. We also examined information curves from the IFA model to characterize scale and item reliability. The information score is a quantification of the variability that a measure captures about the construct of interest and varies across the possible range (standardized) of the construct. Higher information points to lower standard error of measurement and, thereby, greater reliability.
To arrive at the preferred IFA model with acceptably low levels of measurement noninvariance across messages in the message-specific and general PME factors, we estimated a series of increasingly constrained IFA models and compared them using the likelihood ratio (LR) test for nested models. We confirmed model selection by examining global fit of the preferred model using the appropriate IFA χ2 analog and the root mean square error of approximation (RMSEA), item fit with graded response parameterization using the S – χ2 index, and person fit using the Zh index. The preferred IFA model incorporated strong invariance across chemical messages in the general and specific dimensions and had adequate global fit in the adult convenience (G2 = 1839, df = 15606, p > .05), adult probability (M2 = 973, df = 153, p < .001), and adolescent probability (M2 = 277, df = 153, p < .001) samples. The RMSEA (range = 0–0.056) was small in the three samples. The IFA model did not exhibit systematic deviations in item fit in the adult convenience (range S – χ2 = 35.7–46.5, range df = 28–33), adult probability (range S – χ2 = 134–213, range df = 101–112), and adolescent probability (range S – χ2 = 22.4–56.0, range df = 21–29) samples. The model also fit better than expected for a large majority of participants (range Zh > 0 = 77.8–82.9%) in each of the three samples.
Differential item and test functioning
To determine whether individual items on our effects perceptions scale had similar psychometric properties among subgroups that differed by education (adults: ≤ some college, or >some college; adolescents: middle school, or high school), reactance (≤ “neither disagree or agree,” or higher), sex, and smoking status (adults: smoker or not; adolescents: ever-smoker or not), we conducted differential item functioning (DIF) analyses. We treated each message as a potential instance of DIF and conducted separate analyses for each instance using multiple-group unidimensional graded response models. We used the LR/f ratio to select anchor items [49]. Next, we estimated a series of more constrained models and used the LR test for nested models to identify items with any DIF. Additional LR tests revealed whether an instance of DIF was related primarily to the reliability or dimensionality of the involved item or both.
To assess whether any observed DIF caused our effects perceptions scale as a whole to function differently for subgroups in terms of reliability and dimensionality, we conducted differential test functioning (DTF) analyses using effect sizes. Specifically, we calculated Cohen’s d based on a final model with between-group constraints for DIF to characterize the magnitude of any instance of DTF as well as DIF [50]. Effect sizes with absolute values of 0.2 amounted to negligible DIF or DTF while those greater than 0.2 warranted further investigation [50, 51]. DIF testing involves many comparisons, inflating the false-discovery rate. DIF on individual items may cancel out at the scale level if the direction of DIF varies across items within the scale or the magnitude is small. Conducting DTF analyses using effect sizes allowed us to avoid unnecessarily flagging items and pursue all possibilities of DIF without having to correct for inflated false-discovery rates.
Construct validity
We evaluated the construct validity of our effects perceptions scale by examining the average correlations across messages between our scale and the message perceptions scale, message credibility, and message reactance. To take advantage of our multitrait-multioccasion data [52], we used the correlated trait-correlated uniqueness (CTCU) model to estimate all factor correlations and variance components [53]. We also compared the unexplained variance (uniqueness) in the items on our effects perceptions scale and the message perceptions scale to assess the measures’ relative susceptibility to measurement error. The CTCU model in the adult convenience sample had four correlated factors for both measures of PME, message reactance, and message credibility that spanned the two messages. The CTCU model in the probability samples had two correlated factors for our message perceptions scale and message reactance that spanned the six messages. The models retained relevant constraints for measurement invariance from the IFA model for our effects perceptions scale and applied similar constraints for all construct validators. In the three samples, the CTCU model had adequate global fit (RMSEA = 0.074–0.10; CFI = 0.95–0.98).
Results
Sample Characteristics
The mean ages of adult convenience and probability participants were 33.8 (SD = 11.0) and 43.1 (SD = 17.7), respectively; adolescents had a mean age of 15.0 (SD = 1.37). Fewer than half of adult convenience (46.7%) and probability (30.0%) participants had a bachelor’s or advanced degree (Table 2). In both adult samples, around one-third of participants (convenience = 31.1%, probability = 37.4%) were current smokers, and 10.2% of adolescents had ever tried smoking cigarettes.
Participant characteristics
| Adult convenience (n = 999) % | Adult probability (n = 1,692) % | Adolescent probability (n = 869) % | |
|---|---|---|---|
| Age, years | |||
| 13–17 | – | – | 100 |
| 18–25 | 24.9 | 24.9 | – |
| 26–34 | 40.1 | 14.1 | – |
| 35–44 | 17.4 | 12.8 | – |
| 45–54 | 10.2 | 18.4 | – |
| 55–64 | 6.3 | 16.3 | – |
| 65+ | 1.0 | 13.5 | – |
| Male | 54.9 | 45.7 | 48.3 |
| Race | |||
| White | 82.4 | 70.2 | 81.9 |
| Black or African-American | 6.7 | 19.5 | 9.4 |
| Native American | 0.8 | 2.4 | 1.8 |
| Asian | 6.8 | 2.1 | 2.1 |
| Other | 3.3 | 5.7 | 4.7 |
| Hispanic | 8.5 | 7.8 | 6.4 |
| Education | |||
| <High school | 0.7 | 10.2 | 99.4 |
| High school | 12.5 | 25.8 | 0.6 |
| Some college | 28.7 | 23.2 | – |
| Associate’s degree | 11.4 | 10.3 | – |
| Bachelor's degree | 36.4 | 20.0 | – |
| Master’s degree | 8.6 | 7.7 | – |
| Professional or doctoral degree | 1.7 | 2.2 | – |
| Income, annual household | |||
| $0–$24,999 | 26.1 | 33.0 | – |
| $25,000–$49,999 | 35.5 | 26.5 | – |
| $50,000–$74,999 | 21.2 | 17.4 | – |
| $75,000–$99,999 | 10.1 | 10.0 | – |
| $100,000 or more | 7.1 | 13.0 | – |
| Smoker | 31.1 | 37.4 | 10.2 |
Adult smokers were defined as having ever smoked at least 100 cigarettes and currently smoking every day or some days. Adolescent ever smokers were defined as having ever tried cigarettes, even one or two puffs. Missingness was negligible for all participant characteristics and highest for annual household income in the adult probability sample (4.79%).
Psychometric Properties
Our effects perceptions scale measured the same construct in the context of six messages each of which referenced one of five chemicals and provided specific contextual information about it. In the adult convenience sample, the scale’s three items loaded strongly on the general factor for PME (0.89–0.92) and loaded weakly on the message-specific factors (0.18–0.27; Table 3). The general factor for PME accounted for the vast majority of the variance in the items (82.6%). In comparison, the two message-specific factors together explained an additional 5.2% of the variance in the items. These patterns indicated that participants understood the scale similarly in the context of two chemical messages. The adult and adolescent probability samples also replicated these findings across the larger set of six chemical messages.
Factor loadings for the University of North Carolina Perceived Message Effectiveness Scale
| Adult convenience | Adult probability | Adolescent probability | |||||||||||||||
|---|---|---|---|---|---|---|---|---|---|---|---|---|---|---|---|---|---|
| PME | AR1 | FO | PME | AM | AR1 | AR2 | FO | LE | UR | PME | AM | AR1 | AR2 | FO | LE | UR | |
| Discouragement | 0.92 | 0.23 | 0.93 | 0.19 | 0.92 | 0.26 | |||||||||||
| Unpleasantness | 0.91 | 0.18 | 0.91 | 0.31 | 0.91 | 0.36 | |||||||||||
| Concern | 0.89 | 0.27 | 0.86 | 0.37 | 0.89 | 0.35 | |||||||||||
| Discouragement | 0.92 | 0.23 | 0.93 | 0.19 | 0.92 | 0.26 | |||||||||||
| Unpleasantness | 0.91 | 0.18 | 0.91 | 0.31 | 0.91 | 0.36 | |||||||||||
| Concern | 0.89 | 0.27 | 0.86 | 0.37 | 0.89 | 0.35 | |||||||||||
| Discouragement | 0.93 | 0.19 | 0.92 | 0.26 | |||||||||||||
| Unpleasantness | 0.91 | 0.31 | 0.91 | 0.36 | |||||||||||||
| Concern | 0.86 | 0.37 | 0.89 | 0.35 | |||||||||||||
| Discouragement | 0.93 | 0.19 | 0.92 | 0.26 | |||||||||||||
| Unpleasantness | 0.91 | 0.31 | 0.91 | 0.36 | |||||||||||||
| Concern | 0.86 | 0.37 | 0.89 | 0.35 | |||||||||||||
| Discouragement | 0.93 | 0.19 | 0.92 | 0.26 | |||||||||||||
| Unpleasantness | 0.91 | 0.31 | 0.91 | 0.36 | |||||||||||||
| Concern | 0.86 | 0.37 | 0.89 | 0.35 | |||||||||||||
| Discouragement | 0.93 | 0.19 | 0.92 | 0.26 | |||||||||||||
| Unpleasantness | 0.91 | 0.31 | 0.91 | 0.36 | |||||||||||||
| Concern | 0.86 | 0.37 | 0.89 | 0.35 | |||||||||||||
| Variance (%) | 82.6 | 2.6 | 2.6 | 81.5 | 1.5 | 1.5 | 1.5 | 1.5 | 1.5 | 1.5 | 81.9 | 1.8 | 1.8 | 1.8 | 1.8 | 1.8 | 1.8 |
| χ2, df, p | 1839, 15606, >.05 | 973, 153, <.001 | 277, 163, <.001 | ||||||||||||||
| RMSEA, Zh (%) | 0, 81.8 | 0.056, 77.8 | 0.031, 82.9 | ||||||||||||||
Items loaded on a general factor for perceived message effectiveness (PME) and uncorrelated factors for each of the rated messages (e.g., AR1) to control for message-specific variance. AM, ammonia message; AR1 and AR2, arsenic messages; FO, formaldehyde message; LE, lead message; χ2, likelihood ratio (adult convenience) and limited information (adult and adolescent probability) goodness-of-fit indices; RMSEA, root mean squared error of approximation; UR, uranium message; Zh, person-fit index summarized as percentage of cases with good fit.
Among adults, our effects perceptions scale measured very low (convenience: z = −2.5; probability z = −2.3) to moderate levels (convenience: z = 0.2; probability: z = −0.1) of PME with large amounts of information that corresponded to high reliability (≥ 0.85; Fig. 1). In contrast, the scale reliably measured extremely low (z = −2.9) to somewhat low (z = −0.7) levels of PME among adolescents. Furthermore, the scale exhibited high reliability across all measurement occasions or chemical messages in the three samples (see Methods for details on strong invariance in all IFA models). Because the majority of participants (≥55%) in the three samples responded to each of the three items with the highest option, “strongly agree” (coded as 5), irrespective of message, resulting response distributions were left skewed. Thus, our effects perceptions scale did not provide information about individuals who were likely to elicit higher PME than the five-point response scale allowed. This ceiling effect was more pronounced among adolescents and present in all items in the three samples. In the three samples, concern contributed the least amount of information (max = 5.1–7.3) to the scale. Discouragement contributed the most information (max = 7.1) in the adult convenience sample while unpleasant did so in the adult (max = 10.3) and adolescent (max = 17.5) probability samples.
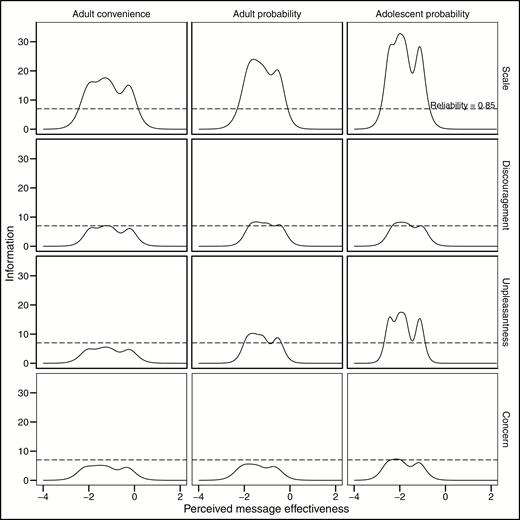
Information curves for the University of North Carolina Perceived Message Effectiveness Scale. Information is a measure of the variability that a scale captures about the construct of interest and varies across the possible range (standardized) of the construct. Higher information points to lower standard error of measurement and greater reliability.
Differential Item and Test Functioning
Among adults and adolescents who varied by education, reactance, sex, or smoking status, our effects perceptions scale exhibited similarly strong psychometric properties (Fig. 2). Across all three samples, the items on our effects perceptions scale exhibited negligible to small DIF (absolute value Cohen’s d = 0.003 to −0.18) in 34 out of 168 potential instances of DIF (all p < .01) and larger DIF (absolute value d = 0.22 to −0.36) in eight instances (all p < .01). The 34 instances of negligible to small DIF were distributed over all three samples, all three items, all four grouping variables, and all six chemical messages. Similarly, the eight instances of larger DIF were distributed over all three samples and all chemical messages even though they involved the concern and discouragement items and smoking status only. These patterns suggested that the items on our effects perceptions scale generally maintained strong psychometric properties among adult and adolescent participants who varied by the aforementioned characteristics.
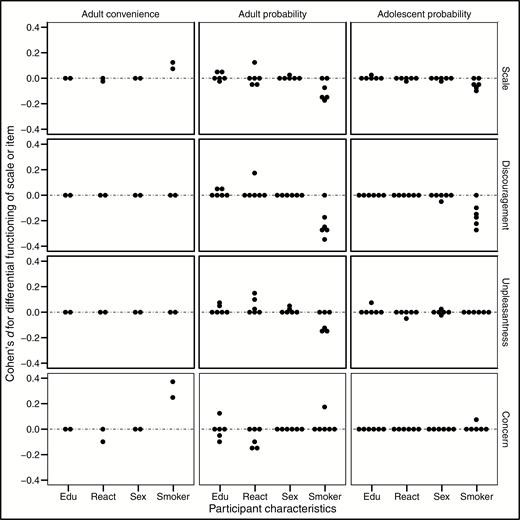
Effect sizes for differential item functioning (DIF) and differential test functioning (DTF) exhibited by the University of North Carolina Perceived Message Effectiveness Scale. Interpretation of Cohen’s d (with respect to absolute value): negligible DIF or DTF, d ≤ 0.2; and DIF or DTF requiring further investigation, d > 0.2. Edu = participant educational attainment (high or low); React = message reactance (high or low).
Most of the statistically significant instances of DIF may be attributable to high power to detect even negligible DIF. DTF analyses provided evidence in support of this possibility. Any observed DIF canceled out due to the presence of an item with DIF in the opposite direction or was minimized by the presence of items with no DIF. As a result, across all 56 potential instances of DTF, our effects perceptions scale did not exhibit DTF in 25 instances and exhibited only negligible to small DTF that did not warrant further investigation in 31 (absolute value d = 0.00 to −0.18). Thus, our effects perceptions scale as a whole maintained strong psychometric properties among adults and adolescents who varied by selected demographic characteristics.
Construct Validity
Our effects perceptions scale demonstrated convergent validity through a high positive correlation with the message perceptions scale (r = .84) and a moderate positive correlation with message credibility (r = .62) in the adult convenience sample. It also demonstrated convergent validity through weak to moderate negative correlations with message reactance in the adult convenience (r = −.49), adult probability (r = −.40), and adolescent probability samples (r = −.30). The items on our effects perceptions scale also had lower amounts of unexplained variance (uniqueness = 0.19–0.21) than those on the message perceptions scale (uniqueness = 0.29–0.39) in the adult convenience sample. Estimates of unexplained variance in the items on our effects perceptions scale in the adult (uniqueness = 0.18–0.24) and adolescent (uniqueness = 0.19–0.21) probability samples were comparable with those in the adult convenience sample.
Discussion
In three large national samples, the UNC PME Scale reliably and validly measured PME among adult and adolescent smokers and nonsmokers and diverse populations. The scale also retained desirable psychometric properties in each sample across all messages describing the harms of chemicals in cigarettes. Thus, researchers should be able to use the scale to evaluate many messages in a single study while being confident that differences in PME ratings between messages are not due to measurement error. Our brief three-item effects perceptions scale should also enable researchers to minimize the cognitive burden on participants from repeated assessments. In situations that require a single-item measure of PME, researchers should use the discouragement or unpleasantness item because both items performed similarly well and better than the concern item.
The finding that the items on the message perceptions scale had greater amounts of unexplained variance than our effects perceptions scale after accounting for PME across the chemical messages suggests that the latter scale had greater conceptual clarity. Moreover, it was less prone than the message perceptions scale to being influenced by methods effects originating from specific messages or unknown sources of multidimensionality. It is possible that specifying the behavior and the rater enabled the effects perceptions scale to elicit clearer PME judgments than the message perceptions scale, which does not use behavioral referents and uses a personal referent only in one item. While researchers have theorized that specifying behavioral and or personal referents should improve the measurement of PME [20], prior studies have not formally examined whether doing so reduces measurement error. Our study provides preliminary evidence that the use of referents can improve the psychometric properties of PME measures [1]. Future studies should investigate the effects of specifying different types of referents on the psychometric properties of PME scales using explanatory item response modeling [54] or generalizability theory [55].
While our effects perceptions scale was strongly positively correlated with the message perceptions scale, there are clear conceptual differences between general perceptions of a message and perceptions that a message would affect the respondent. It is conceivable that message perceptions are further from behavior, while effects perceptions are more proximal to behavior. Moreover, message perceptions may affect effects perceptions such that the extent to which a person believes a message would affect them may be based, at least in part, on their perceptions of whether the message is believable, compelling, and so forth. Future studies should confirm that effects perceptions predict the impact of health messages on behavior, examine whether message perceptions do so as well independently or serially through effects perceptions, and compare the two scales’ predictive power. However, from a practical standpoint, the purpose of PME measures is to guide selection of a small set of messages that have the most potential to change behavior, from a larger pool of messages. For that purpose, there may be an advantage in using effects perceptions measures that directly ask participants whether messages are likely to have effects. While some recent work has questioned the validity of PME judgments in predicting actual effectiveness, a close examination of the corresponding [22, 56] and other [1] measures reveals a striking lack of consistent measurement of PME and little evidence of strong psychometric properties. Improving measurement properties is likely to improve the precision of PME measures in guiding the selection of promising messages.
Strengths and Limitations
The main strengths of our study were the three large, diverse national samples and repeated-measures designs, which provided us with opportunities to replicate our basic findings about the psychometric properties of the UNC PME Scale in the context of several chemical messages and populations. Another major strength of our study was the use of latent variable models that took advantage of all of the data in a sample (e.g., two-tier item bifactor analysis) to provide robust inferences about the performance of our brief scale.
The main limitation of our study is that the construct validity data exclusively came from comparison with one other PME scale [40] and cognitive measures that are theoretically relevant to message development. Because researchers are often interested in the potential impact of persuasive messages on behavior, future studies should examine the predictive validity of the UNC PME Scale with behavior. Another limitation is that our study only focuses on messages about cigarette smoking. Future studies should replicate our findings in the context of messages about other health risk behaviors (e.g., sugar-sweetened beverage consumption) as well as health promoting behaviors (e.g., physical activity) to confirm that the UNC PME Scale is applicable to diverse health messaging contexts. In the context of health promoting behaviors, the UNC PME Scale may require reframing the effects perceptions (e.g., changing discouragement to encouragement). Finally, future studies should report psychometric analyses of the UNC PME Scale in the context of chemical messages that differ in format as well as messages for other health risk behaviors that incorporate varied message elements.
Conclusions
The UNC PME Scale is a brief measure with three strongly performing items that should enable researchers to efficiently and effectively evaluate health messages among diverse populations. While our findings are specific to chemical messages that seek to prevent cigarette smoking, the wording of the PME items is general so that the scale should be readily adaptable to messages for other health risk behaviors.
Acknowledgments
Research reported in this publication was supported by grant number P50CA180907 from the National Cancer Institute and Food and Drug Administration (FDA) Center for Tobacco Products. Research reported in this publication was also partially supported by the National Institute on Drug Abuse through grant funding awarded to N.C.G. (K01DA0351523). The content is solely the responsibility of the authors and does not necessarily represent the official views of the National Institutes of Health or the FDA.
Compliance With Ethical Standards
Authors’ Statement of Conflict of Interest and Adherence to Ethical Standards The authors declare that they have no conflicts of interest.
Authors’ Contributions Sabeeh A. Baig, Seth M. Noar, Marcella H. Boynton, Noel T. Brewer, and Kurt M. Ribisl contributed to study design. Seth M. Noar led scale conceptualization with Marcella H. Boynton conducting early analyses. Sabeeh A. Baig led psychometric analyses with input from Nisha C. Gottfredson and Noel T. Brewer. Sabeeh A. Baig also led manuscript writing with all authors significantly contributing to conceptualization and revision.
Ethical Approval All procedures performed in studies involving human participants were in accordance with the ethical standards of the institutional and/or national research committee and with the 1964 Helsinki declaration and its later amendments or comparable ethical standards.
Informed ConsentInformed consent was obtained from all individual participants included in the study.
