


INTRODUCTION
The NIH Toolbox Cognition Battery (NIHTB-CB) is one module within the larger “NIH Toolbox for the Assessment of Neurological and Behavioral Function” initiative that was created to provide a brief (30-min), widely accessible, and easily administered cognitive screener. This fully computerized battery was also developed to capture the lifespan (ages 3–85) and is available in both English and Spanish (Gershon et al., Reference Gershon, Wagster, Hendrie, Fox, Cook and Nowinski2013). These properties, along with its nonproprietary nature, are proposed to make the NIHTB-CB particularly well positioned for epidemiological and longitudinal clinical research studies. The primary goal of the NIH Toolbox initiative was to develop an assessment tool for clinical research on a common metric for cross-study comparisons. As such, the NIHTB-CB was not conceptualized as a substitute for in-depth, comprehensive neuropsychological batteries, or as a neurodiagnostic tool (Gershon et al., Reference Gershon, Wagster, Hendrie, Fox, Cook and Nowinski2013). Therefore, although the NIHTB-CB may have potential use as a brief clinical neurocognitive screener to help identify individuals appropriate for referral for comprehensive neurological assessments, validation is still needed to determine its clinical utility. The battery consists of seven tests measuring five neurocognitive domains (i.e., Executive Functions, Episodic Memory, Processing Speed, Working Memory, Language), which are separated broadly into “fluid” (five tests) and “crystallized” (two tests) abilities (Weintraub et al., Reference Weintraub, Dikmen, Heaton, Tulsky, Zelazo, Bauer and Gershon2013). “Fluid” neurocognitive abilities are viewed as dynamic thinking skills (e.g., episodic memory, processing speed) and reflect biologically based brain processes, which change with age throughout the lifespan and are sensitive to acquired brain injury or disease (Cattell, Reference Cattell1971; Horn, Reference Horn1968, Reference Horn1970). “Crystallized” abilities, on the other hand, tend to develop rapidly during childhood and then largely stabilize, or even slightly improve, with additional age and experience. These abilities also are less susceptible to being impacted by brain injury or disease, and conceptually, represent the material one tends to learn in school and other life experiences. The NIHTB-CB includes Fluid and Crystallized Composite Scores, as well as a Total Cognition Composite, which reflects an individual’s overall “g factor” akin to a Full Scale IQ score (Akshoomoff et al., Reference Akshoomoff, Beaumont, Bauer, Dikmen, Gershon, Mungas and Heaton2013; Heaton et al., Reference Heaton, Akshoomoff, Tulsky, Mungas, Weintraub, Dikmen and Gershon2014).
Previous work has established the significant impact of demographic factors on neurocognitive test performances, and in fact, complex relationships may be observed for age, education and sex across distinct racial and ethnic backgrounds (e.g., Heaton, Miller, Taylor, & Grant, Reference Heaton, Miller, Taylor and Grant2004; Heaton, Ryan, & Grant, Reference Heaton, Ryan and Grant2009; Norman, Evans, Miller, & Heaton, Reference Norman, Evans, Miller and Heaton2000; Norman et al., Reference Norman, Moore, Taylor, Franklin, Cysique and Ake2011). For instance, not surprisingly, increasing age in adults and fewer years of education are consistently and strongly associated with poorer performances, while differential sex effects typically favoring females are also observed, particularly in episodic memory (Heaton, Miller, et al., Reference Heaton, Miller, Taylor and Grant2004). Although less frequently adjusted for, background factors associated with race and ethnicity also have important influences on neuropsychological performances. For example, compared to White individuals, African Americans tend to demonstrate poorer performances across a variety of neurocognitive tests, including learning and memory, processing speed, and problem-solving (e.g., Diehr et al., Reference Diehr, Cherner, Wolfson, Miller, Grant and Heaton2003; Gasquoine, Reference Gasquoine2009; Heaton, Miller, et al., Reference Heaton, Miller, Taylor and Grant2004; Norman et al., Reference Norman, Evans, Miller and Heaton2000, Reference Norman, Moore, Taylor, Franklin, Cysique and Ake2011). Of note, these racial/ethnicity disparities on neuropsychological testing may well be accounted for by quality of education (even after controlling for years of education), literacy, acculturation, and other background differences as opposed to any direct result of race/ethnicity, per se (Byrd et al., Reference Byrd, Touradji, Tang and Manly2004; Manly, Byrd, Touradji, & Stern, Reference Manly, Byrd, Touradji and Stern2004; Manly, Jacobs, Touradji, Small, & Stern, Reference Manly, Jacobs, Touradji, Small and Stern2002). Nevertheless, application of race/ethnicity as a proxy for these background factors aids in adjusting for such premorbid influences that are not due to acquired brain injury.
Additionally, important linguistic and cultural influences may be observed on neuropsychological test performances depending on the language of administration, even on tests purported to measure the same ability (Gasquoine, Reference Gasquoine2009; Loewenstein, Arguelles, Barker, & Duara, Reference Loewenstein, Arguelles, Barker and Duara1993; Mungas et al., Reference Mungas, Reed, Haan and Gonzalez2005). For instance, on a neuropsychological battery developed to be comparable across Spanish and English speakers (Spanish and English Neuropsychological Assessment), the authors found that language use accounted for up to 44.0% of the variance in performance, such that greater frequency of Spanish was associated with lower scores (Mungas et al., Reference Mungas, Reed, Haan and Gonzalez2005). Accurate classification of neuropsychological impairment is dependent on the normative comparison applied (i.e., what are expected levels of performance for the individual if s/he has normal brain function). When such normative standards are based upon subject samples that do not closely resemble the individual assessed, misclassified impairment may occur, which has important public health and treatment implications. Development of appropriate normative standards is, therefore, critical for any novel neuropsychological measure.
Normative standards for the NIHTB-CB were originally developed and are currently available online, yet there are several potential problems with the manner in which they were created. First, although the scores were overall corrected for age, education (or mother’s education for children), sex, and race/ethnicity, these corrections were calculated across children and adults together and collapsed across those tested in Spanish and in English. Conducting normative corrections across children and adults may be problematic because there are differential demographic relationships with neuropsychological test performances in these two cohorts. For example, in children, age is strongly, positively associated with neurocognition, while in adults, neurocognitive performances on most tests decrease with age. Additionally, given that mothers’ years of education was used for the education correction in children, the “education” variable used in the original NIHTB-CB norms does not reflect the same latent variable for children and adults, and may likely demonstrate different associations with performances (Heaton, Miller, et al., Reference Heaton, Miller, Taylor and Grant2004). Relatedly, given that the NIHTB-CB is administered in different languages for Spanish and English speakers, whose cultural and other background characteristics are likely to be quite different in ways that were not assessed or controlled, collapsing normative corrections across these two groups may be problematic. Given the complex demographic and cultural relationships specific to each of these disparate cohorts, linear regression models within the entire normative sample as a whole cannot be expected to fully account for these associations (e.g., interactions between demographics and race/ethnicity or language of administration). Therefore, one of the major goals of the current norm development was to establish standards for children and adults, and Spanish and English speakers, separately. In this manner, the normative scores will be more representative of each specific group of individuals, and better able to account for such cohort-related factors (e.g., within-group cultural factors).
The second drawback of the original NIHTB-CB normative standards is in the method by which race and ethnicity were corrected. In the original norms, nominal values for race/ethnicity (i.e., non-Hispanic White, non-Hispanic African American, non-Hispanic Other, or Hispanic) were entered into the regression model to account for their variance across the entire normative cohort. However, given that differential associations are observed between other demographics (e.g., age and education) and neuropsychological performances across racial and ethnic groups (Heaton et al., Reference Heaton, Miller, Taylor and Grant2004; Heaton, Marcotte, et al., 2009), this method may not fully capture and account for these distinct relationships. As a result, we will show that disproportionate and significant relationships between demographics and NIHTB-CB scores still exist in the original fully corrected scores for some racial/ethnic groups. Therefore, the second primary aim of the current project was to develop normative standards separately for each sufficiently large racial/ethnic group to capture and account for demographic relationships with NIHTB-CB performances that may differ across racial/ethnic groups.
In the current normative project, we created fully demographically corrected scores that were developed independently for each major racial/ethnic group in children and adults separately, and by language (English vs. Spanish). Only the normative standards for the English speakers are presented here, while the norms specific to the NIHTB-CB in Spanish will be presented in a complementary study. In addition to the fully corrected scores, we also present standards for uncorrected NIHTB-CB scores that are weighted to the 2010 U.S. Census demographics and represent an individuals’ performance as compared to the general U.S. population, as well as age-corrected standards, which were again created separately in children and adults and indicate an individuals’ developmentally adjusted performance.
METHODS
Participants
The normative sample consisted of healthy community-dwelling children and adults ages 3–85 years old recruited at 10 U.S. testing sites (Beaumont et al., Reference Beaumont, Havlik, Cook, Hays, Wallner-Allen, Korper and Gershon2013). Participants needed to be capable of following instructions in English, have adequate visual, auditory, vestibular, and motor functioning to complete all items in the full Toolbox test battery, or availability of assistance or assist devices to complete tasks. Trained research associates conducted structured interviews and administered questionnaires to potential participants to assess inclusion and exclusion criteria. In brief, research associates were trained on how to administer the NIH Toolbox as coordinated by Northwestern University (NU) using a 4-week “train the trainers” model. The certification process included training, practice, and certification at all levels as monitored by NU personnel. NU certifiers also acted as site monitors and supervised the set-up, administration, and on-going data collection at each site. Additionally, NU and vendors had weekly status update calls that focused on enrollment, demographic quotas, and quality assurance throughout the normative data gathering process. This project was conducted in accordance to the Helsinki Declaration; written informed consent was obtained from all participants via a protocol that covered all testing sites approved by the institutional review board at Northwestern University.
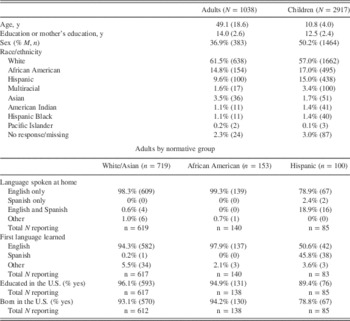
This study included 1038 adults (≥18 years old) and 2917 children (3–17 years old) who were administered the NIH Toolbox Cognition Battery (NIHTB-CB) in English (see Table 1 for demographic and background information). Participants self-identified race and ethnicity, age, sex, and years of education on standard questionnaires; for children, mother’s years of education was used as a predictor of child performance. Only those racial/ethnic groups that included sufficient sample sizes (≥100) were included for full demographic corrections: Adults: 719 Non-Hispanic White/Asians, 153 African Americans, and 100 Hispanics; and Children: 1710 Non-Hispanic White/Asians, 494 African Americans, 482 Hispanics, and 100 children who identified multiple races. Other racial/ethnic groups whose sample sizes were not large enough to create fully corrected norms (e.g., Pacific Islander, American Indian) were included in Census-matched uncorrected and age-corrected normative calculations (see Table 1). Of note, due to their modest representation in the normative samples, we were unable to create a separate normative standard for Asian individuals (N=36 adults and 51 children). However, it was determined that Asians were most comparable to Whites (vs. other ethnic groups) in terms of years of education [adults: Asian M=15.0 (SD=2.6) years and non-Hispanic White M=14.1 (SD=2.6) years; children: Asian M=14.3 (SD=3.0) mother’s years and non-Hispanic White M=12.9 (SD=2.1) mother’s years]. Additionally, we determined comparability on uncorrected NIHTB-CB test Composite performances. Therefore, to provide a standard for use with Asian individuals, we combined White and Asian adults as well as children into the same normative cohorts, respectively. After creating our normative scores, Asian and non-Hispanic white adults and children did not significantly differ across any of the Toolbox composite measures (ps >.05; e.g., Fully corrected Total Composite White vs. Asian: Adults: Mean Ts=50.1 vs. 48.0; Children Mean Ts=50.0 vs. 50.9), supporting the combination of these groups.
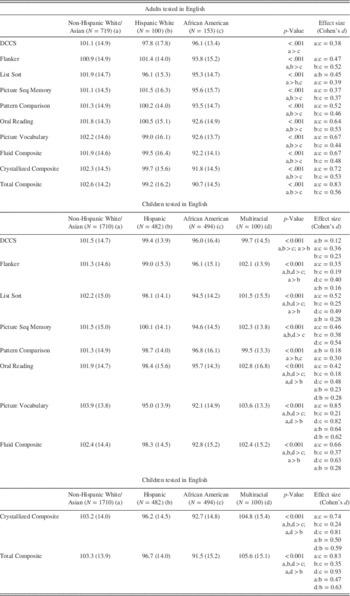
Table 1. Demographic and background characteristics of the adult and child normative samples
NIH Toolbox Cognition Battery (NIHTB-CB) Measures
The NIHTB-CB is a computerized assessment including seven measures and takes approximately 30 min to administer. Detailed descriptions of the individual Toolbox Cognition measures are provided in Weintraub et al. (Reference Weintraub, Dikmen, Heaton, Tulsky, Zelazo, Bauer and Gershon2013), and Heaton et al. (Reference Heaton, Akshoomoff, Tulsky, Mungas, Weintraub, Dikmen and Gershon2014) describes the validation of the Composite Scores. In brief, the Picture Vocabulary test uses an audio recording of words, presented with four photographic images on the computer screen, and participants must select the picture that best corresponds to the meaning of the word. On the Oral Reading Recognition test, participants are asked to read and pronounce letters and words as accurately as possible. Dimensional Change Card Sort (DCCS) is a measure of cognitive flexibility in which two pictures are presented that vary along two dimensions (shape, color) and participants are asked to quickly match a series of test pictures to the target pictures switching between matching dimensions. The Flanker Inhibitory Control and Attention Test requires participants to focus on a given middle stimulus in a series and respond quickly while inhibiting attention to similar stimuli flanking it. The Picture Sequence Memory Test involves recalling the order of increasingly longer series of pictured objects and activities presented on the computer screen with corresponding audio-recorded phrases being played; participants are asked to recall the sequence of the pictures over two learning trials. On the List Sorting Test, pictures of different foods and animals are presented along with audio recordings and written text; participants are asked to say the items back in size order from smallest to largest, first within a single dimension (i.e., food or animals) and then on two dimensions (i.e., food then animals). Lastly, on the Pattern Comparison Test, participants must quickly decide whether pairs of side-by-side pictures and designs are the same or not. Of note, in future use, children ages 3–6 may complete the early childhood “step-down” battery, which only includes the Flanker, Picture Sequence Memory, DCCS, and Picture Vocabulary tests; however, for the purposes of this normative study, all children completed all of the Toolbox measures.
Data Analyses
To help control for Type I error due to large sample sizes and multiple analyses, a somewhat conservative alpha value of 0.01 was used to indicate significance for all analyses.
Uncorrected 2010 U.S. Census Weighted Normalized Standard Score Derivation
For the uncorrected normalized scores, we demographically weighted our cohort of English-speaking participants to match the 2010 U.S. Census. In this manner, the uncorrected norms better represent the people who exist in the “true” population. To achieve this, we applied raking procedure (Deming & Stephan, Reference Deming and Stephan1940) using SAS macro “raking” by Battaglia and colleagues (Battaglia, Hoaglin, & Frankel, Reference Battaglia, Hoaglin and Frankel2012) to assign each individual a weight based on his/her age, sex, education, and race/ethnicity such that the weights ultimately represented proportions reported in the 2010 Census.
Raw scores for each test in the Census-weighted sample were converted to sample-based normalized standard scores (M=100; SD=15). In this manner, the normalized standard scores represent an individual’s performance compared to the average English-speaking person in the United States. The summary demographics for the Census-weighted cohort (including both children and adults) were as follows: M age=38.2 (SD=21.1); M education=13.7 (SD=2.6); 50.6% Female; 68.3% White, 13.2% Hispanic, 11.8% African American, 2.4% Asian, 0.9% American Indian, and 0.2% Pacific Islander. These scores may be most useful when attempting to determine an individual’s “absolute” level of functioning regardless of age, sex, education, or race/ethnicity; therefore, these may particularly useful for assessment of everyday functioning capacity or evaluation of absolute functioning of the same individual or group across time.
Age-Corrected Standard Score Derivation
Age-corrected standard scores were computed separately for children and adults based on raw test scores. All norming analyses were performed with the statistical software R (www.r-project.org) and R package mfp (Ambler & Benner, 2008). Raw test values were initially converted to normalized scores by obtaining their standardized quantiles and scaling them to have a mean of 10 and standard deviation of 3 (see online Appendices 1 and 2). These normalized test scores were then regressed on age, using fractional polynomials. Fractional polynomials allow fitting non-linear terms, if they explain variability in the outcome significantly better than a simple linear pattern. The residuals for the regression equations were obtained. The uncorrected residual for each individual represents the difference between the observed scaled score and expected scaled score for that individual’s age. The residuals may have a different spread (i.e., variance) across age groups for various reasons, including random chance. To make the variances across age more homogeneous, the residuals within each age group were corrected based on how far, on average, they fell from the expected value. Specifically, multiple fractional polynomials were used to regress absolute values of residuals on age. The resulting curves estimated the smoothed absolute average distance of residuals for each age group. Larger distances from the smooth mean correspond to larger residual variance and smaller distances from the smooth mean correspond to smaller residual variances. The uncorrected residuals within each age group were then divided by the smoothed mean distance estimated for that particular age group. Thus, residuals for those age groups that had large residual variances (large average distance) were brought closer to their mean, while residuals for age groups with small residual variances (small average distance) were extended further so that, on average, the residuals for the whole sample had approximately equal variances across age.
The standardized corrected residuals formed age-adjusted standard scores (M=100; SD=15). These scores represent an individuals’ neurocognitive performance compared to peers his/her age and may be most applicable when determining developmentally appropriate cognitive functioning (e.g., in school settings), or for comparing with other age-adjusted scores (e.g., IQ scores). The stability of fractional polynomials were supported using bootstrapping with 1000 samples (Royston & Sauerbrei, 2003).
Fully Demographically Corrected T-Score Derivation
We opted to use a standard metric of T-scores (M=50; SD=10) for the fully corrected scores to make an obvious distinction from both the uncorrected and age-corrected scores, and because the fully corrected scores are expected to be most useful in neuropsychological applications in which T-scores are a common metric.
Normative standards for the fully corrected scores were created separately for children and adults, and by racial/ethnic group to result in seven norming groups: (1) adult non-Hispanic White/Asian, (2) adult African-American, (3) adult Hispanic, (4) child non-Hispanic White/Asian, (5) child African-American, (6) child Hispanic, and (7) child Multiracial. Using R (www.r-project.org) and R package mfp (Ambler & Benner, 2008), a standardized algorithm was applied to the raw test scores in each racial/ethnic normative group separately. Raw test values were converted to normalized scores by obtaining their standardized quantiles and scaling them to have a mean of 10 and standard deviation of 3 (see online Appendices 1 and 2). In each racial/ethnic norming group, scaled scores were then regressed on age, education, and sex using fractional polynomials for continuous predictors (age and education), which were evaluated for stability using a bootstrap procedure (Royston & Sauerbrei, 2003). The residuals for each of the normative groups were obtained and corrected to achieve variance homogeneity across all demographic characteristics, using smoothing methods described in the previous section. The standardized corrected residuals formed demographically adjusted T-scores (M=50 and SD=10). Fully corrected T-scores represent an individual’s level of cognitive functioning compared to age-, education-, sex-, and race/ethnicity-matched peers, and are most helpful in determining possible neurocognitive decline (in the context of a brain disorder) compared to “expected” normal levels of performance for the individual being assessed.
Of note, we were only able to gather a limited range of education per racial/ethnicity norming group. Application of the demographically corrected normative formulas for individuals with educational levels outside of these specified ranges is not recommended to avoid problems of extrapolation (i.e., predictions outside of the original range). Specifically, the following educational levels are appropriate for use in the formulas: (1) Adult White/Asian education 8–20 years; (2) Adult African American and Hispanic education 10–20 years; (3) Child White/Asian mother’s education 4–20 years; (4) Child African American mother’s education 3–20 years; (5) Child Hispanic mother’s education 3–18 years; (6) Child Multiracial mother’s education 8–20 years.
NIHTB-CB Composite Score Creation
Composite Scores (i.e., Fluid, Crystal, and Total) were created for the uncorrected, age-corrected, and fully demographically corrected scores, separately. The following adjusted test values were averaged for each Composite and then re-distributed to have a M=100, SD=15 (uncorrected and age-corrected Composites) or M=50, SD=10 (fully corrected Composites): (1) Fluid Composite: average of Flanker Inhibitory Control and Attention Test, Picture Sequence Memory Test, List Sorting Test, Pattern Comparison Test, and Dimensional Change Card Sort Test; (2) Crystallized Composite: average of Oral Reading and Picture Vocabulary; and (3) Total Cognition Composite: average of the Fluid and Crystallized Composites.
NIHTB-CB Composite Score “Impairment” Cut-Point
To increase clinical interpretation, we calculated cut-points one standard deviation below the mean (T<40) to indicate “impairment” across the fully corrected Composites (Taylor & Heaton, Reference Taylor and Heaton2001). Using the normal curve, we expect such a cut-point to demonstrate 84% specificity (i.e., 16% “impairment”) among healthy individuals.
Original versus New NIHTB-CB Normative Standards
Finally, we compared the fully corrected, newly created normative standards against the fully corrected norms previously posted online for the NIHTB-CB. First, we examined within-subject differences on the fully corrected NIHTB-CB test and Composite scores between the two normative standards by averaging the absolute difference between the T-scores on the two scoring methods (e.g., |Original Flanker scores – New Flanker score|). Then we explored any significant residual demographic effects on the previously fully corrected scores using correlational or analysis of variance (ANOVA) analyses, where appropriate.
RESULTS
Normalized Uncorrected Standard Scores (U.S. Census Weighted)
See online Appendix 2 for formulas to convert raw NIHTB-CB scores to uncorrected standard scores weighted against the English-speaking U.S. Census. The average 2010 Census individual (for purposes of comparison) was: 38.2 years old, with 13.7 years education, 51% female, and 68% White. In the entire U.S. Census weighted sample, all NIHTB-CB tests and composite scores had a mean=100 and SD=15. Within the participants from our unweighted normative sample (n=3955), the mean uncorrected Census-weighted Composite Score values for adults generally fell within the average range of the U.S. population: Fluid M=100.7 (SD=12.4), Crystallized=104.3 (9.1), and Total=102.4 (10.5); whereas, as expected, children’s performances were lower: Fluid=94.1 (19.5), Crystallized=83.5 (17.5), and Total=87.2 (19.9).
Impact of Demographic Characteristics on the NIHTB-CB
Age effects
Figure 1 and Table 2 illustrate the significant effect of age on uncorrected NIHTB-CB performances (shown as broken lines in Figure 1) for our total subject sample (ps<.01). As demonstrated in Figure 1, both Fluid and Crystallized uncorrected NIHTB-CB performances rapidly increase until ages 18–29. At this point, the developmental trajectories diverge. Fluid abilities appear to peak (ages 18–29), and then steadily decline through adulthood; on the other hand, Crystallized abilities peak slightly later in life (ages 30–39) and then stabilize. Among adults, the Fluid Composite demonstrated the strongest negative relationship with age (r=−0.65), with Pattern Comparison (processing speed) showing the largest negative association (r=−0.59). Small to negligible positive relationships were observed in adults between age and the Crystallized scores (Reading and Vocabulary; r’s=0.04–0.15; Table 2). By contrast, in children, age was strongly and positively associated with all NIHTB-CB measures and Composite scores, with Vocabulary demonstrating the strongest (r=0.83) and Picture Sequence Memory the least strong (r=0.60) of such developmental effects. The solid lines in Figure 1 illustrate Fluid and Crystallized scores corrected for such age effects; in both children and adults, age was not significantly related to any of the age-corrected NIHTB-CB measures or Composite scores (p’s>.20).
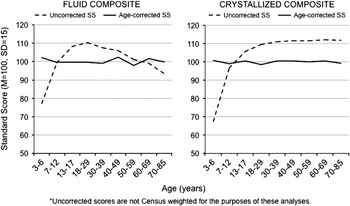
Fig. 1 Uncorrected* and age-corrected NIH Toolbox Cognition Battery Fluid and Crystallized composite performances by age.
Table 2. Linear univariable effects of demographic variables on NIH Toolbox Cognition Battery performance
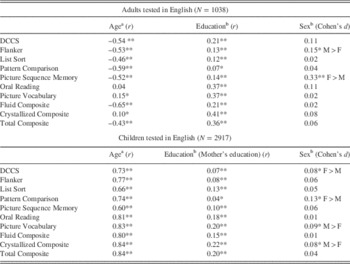
a Values reflect relationships with uncorrected unweighted (i.e., not weighted to U.S. Census) normalized test scores.
b Values reflect relationships with age-corrected test scores.
**p<.001.
*p<.05.
Education effects
The left panel of Figure 2 illustrates the overall positive impact of education on age-corrected NIHTB-CB performances in children and adults. Education was positively associated with all individual age-corrected test performances (p’s<.01; see Table 2). As expected, education was most strongly correlated with adults’ Crystallized performances (Reading and Vocabulary r’s=0.37). Among children, not surprisingly, mothers’ education demonstrated weaker (but still positive and significant) relationships with the NIHTB-CB measures than were observed in adults. The strongest associations in children were, again, with Vocabulary (r=0.20) and Reading (r=0.18). As illustrated in the right panel of Figure 2, education was not associated with any of the NIHTB-CB fully adjusted scores.

Fig. 2 Age- versus fully corrected Fluid composite scores by education across adults and children. Note: SS = Standard Score.
Sex effects
Sex was more inconsistently, although at times significantly, associated with age-corrected NIHTB-CB test performances among adults and children. In adults, Picture Sequence Memory (females>males; p<.001) and Flanker (males>females; p<.001) demonstrated the strongest sex effects. In children, Pattern Comparison showed the largest sex-related differential (females>males; p<.01; see Table 2).
Race/ethnicity effects
A series of ANOVAs revealed significant differences in performances across age-corrected standard scores by race/ethnicity on all of the NIHTB-CB tests and Composite scores, both for adults and children (see Table 3 and Figures 3 and 4; p’s<.001). Using the Total Composite to illustrate, both African American adults and children demonstrated the worst overall performance (p’s<.001). Hispanic children additionally performed poorer than White/Asian and Multiracial children on the Total Composite (p’s<.001), with the latter two groups showing comparable performances. This pattern of race/ethnicity influences was consistent across the NIHTB-CB individual tests and other composite measures (Table 3).
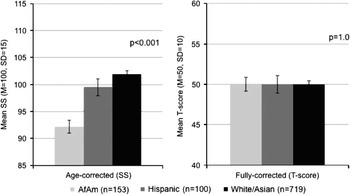
Fig. 3 Age- versus fully corrected fluid composite scores by race/ethnicity in adults. Note: AfAm=African American; SS=Standard Score.
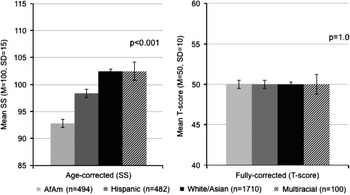
Fig. 4 Age- versus fully corrected Fluid composite scores by race/ethnicity in children. Note: AfAm=African American; SS=Standard Score.
Table 3. NIH Toolbox Cognition Battery performance (age-corrected Standard Scores across racial/ethnic groups; mean, SD)
Demographic interactions
Although our norming program does not allow for correction of interactive effects, we aimed to determine whether any interactions did exist among age, education, and sex on the NIHTB-CB Composite scores within each of the racial/ethnicity norming groups that may not be accounted for. We found only one significant age × education interaction: On the Crystallized Composite, in the White/Asian adult cohort, older adults with more years of education performed the best, while younger adults with fewer years of education performed the worst (p’s<.001). No other significant interactions among demographics emerged. Of note, given that our normative standards were created separately within each racial/ethnic group, all possible demographic interactions with race/ethnicity were, by design, accounted for.
Fully Demographically Corrected NIHTB-CB T-Scores
Adults
Fully demographically corrected T-scores across each racial/ethnic group demonstrated a mean T=50 and SD=10 for all measures, and there were no significant effects of demographic factors on the resulting T-scores. Using T<40 (−1 SD) as an operational definition of “impairment,” which aims for approximately 84% specificity, normal adults demonstrated impairment rates between 14.6% and 16.2% across racial/ethnic groups on the Fluid Composite and 15.5%–18.1% on Total Composite, as expected (Figure 5). Among the adult Hispanic participants, however, although the Crystallized Composite demonstrated a mean T=50 (SD=10) and a statistically normal distribution, when using a cut-point of T<40, a 19.8% impairment rate was observed. After closer examination, it appeared that participants who were educated outside of the United States performed poorer on the fully corrected Vocabulary test (T=42.4 vs. T=50.9; p=.02). When those individuals were excluded (n=9), the Crystallized Composite impairment rate reduced to 16.5%. As such, it is important to note that there may be an slightly increased probability of Crystallized “impairment” among Hispanics, especially among those not educated in the United States. Otherwise, the Crystallized Composite T<40 demonstrated expected levels of specificity among the White/Asian and African American cohorts (15.1–16.3%; see Figure 5).

Fig. 5 Fully demographically adjusted (age, education, sex, race/ethnicity) NIH Toolbox Cognition Battery impairment rates across children and adults. Note: “Impairment” classified as T-score <40; AfAm=African American. *Crystallized Composite for Hispanic adults excludes n=9 individuals educated outside of the United States.
Children
All demographically corrected T-scores for children demonstrated a mean T=50 and SD=10, and no significant effects were found for demographic factors. Across the racial/ethnic groups, T<40 impairment rates ranged from 15.8–18.3% on the Fluid Composite, 15.5–16.1% on the Crystallized Composite, and 12.9%–15.8% on the Total Composite (Figure 5).
Fully Corrected NIHTB-CB Scores: Norms Originally Posted Online versus New Norms
The original fully corrected NIHTB-CB Composite scores were strongly correlated to the new normative Composite scores in both children (r’s=0.87 to 0.94) and adults (r’s=0.94). However, absolute values of the difference between the original and new normative standards across the individual NIHTB-CB tests demonstrated an average 2.7 T-score point difference (SD=1.2; range=<0.1–21.3) among adults and an average 3.3 T-score point difference (SD=1.6; range=<0.1–32.0) in children. On the Composite scores, differences similarly ranged from an average 2.8 to 3.3 T-score points among adults (range=<0.1–15.4), and 2.8 to 3.9 T-score points among children (range=<0.1–22.5; Figure 6).
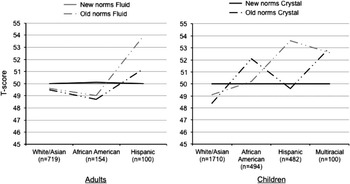
Fig. 6 NIH Toolbox Cognition Battery fully demographically adjusted T-scores: Original norms versus new norms compared by racial/ethnic group.
Importantly, when participants were split into the racial/ethnic norming groups, significant demographic relationships still existed with the original fully corrected scores. Among adults, DCCS, Reading and Vocabulary scores maintained significant, small-to-medium associations with years of education across the racial/ethnic groups (p’s<.001), and the DCCS showed trend-level associations with age among Hispanic (r=0.23; p=.03) and African American individuals (r=0.18; p=.03). In children, both Fluid and Crystallized measures demonstrated modest negative relationships with age and mother’s education across the racial/ethnic cohorts. These unexpected negative relationships with age and education suggest that the original norms over-corrected for these factors in children. Lastly, sex effects were apparent on Picture Sequence Memory among African American, White/Asian, and Multiracial children (all M>F; AfAm: F(1,375)=5.9; p=.02; White/Asian: F(1,1379)=31.3; p<.001); multi: F(1,73)=12.0; p<.001), on Vocabulary among Multiracial children (M>F; F(1,71)=5.1; p=.03), on DCCS (M>F; F(1,1616)=12.7; p<.001), and on Pattern Comparison among White/Asian children (F>M; F(1,1622)=5.5; p=.02) and Reading (F>M; F(1,1633)=12.8; p<.001). Overall, it appears that there may have been interactions with demographic factors across racial/ethnic groups that were not fully accounted for in the original normative parameters. These were taken into account by the distinct racial/ethnicity norms developed here. Lastly, there were also significant main effects of race/ethnicity on the original fully corrected scores. In adults, racial/ethnic group differences were observed on the DCCS, List Sorting, Flanker, and Pattern Comparison fully corrected scores (p’s<.01), such that Hispanic adults performed the best compared to the other ethnicity groups. In children, differences were observed across all of the originally fully corrected NIHTB-CB tests by racial/ethnic group (p’s<.004), such that the White/Asian children tended to score the lowest (even though their actual raw performances were the highest).
Of note, while rates of impairment on the newly created, fully corrected scores reported here ranged from 10.6% to 17.7% across individual NIHTB-CB tests (% Ts<40), impairment rates on the original NIHTB-CB normative standards were highly variable across tests, ranging from 6.3% to 20.4% across the racial/ethnic groups. For example, African American adults evidenced over 20% impairment on Pattern Comparison, while Multiracial children demonstrated only 7.6% impairment on this test.
DISCUSSION
Development of appropriate normative standards is a critical step when creating a novel neuropsychological tool to differentiate expected levels of performance versus those indicating possible brain-related impairment. Although norms were originally created for the NIH Toolbox Cognition Battery (NIHTB-CB), some potentially problematic methods (e.g., collapsed across children and adults, and those tested in Spanish and English) lead us to reconsider and revise the normative standards available for this battery. Consistent with previous neuropsychological assessments (Heaton, Miller et al., Reference Heaton, Miller, Taylor and Grant2004), age, education, sex, and race/ethnicity each demonstrated relationships with NIHTB-CB performances, which both supports the validity of this novel battery (e.g., sensitivity to expected age-related differences in neurocognitive functioning) and the need for such demographic corrections. Here, we present three types of scores that may be used for the NIHTB-CB: (1) uncorrected, normalized scores; (2) age-corrected scores; and (3) fully demographically corrected scores. Each of these sets of scores may be used to answer different questions. Uncorrected scores are best interpreted as one’s absolute level of cognitive capacity compared to the average U.S. individual and provides a common metric that may be useful in longitudinal applications. Age-corrected scores may be used to determine developmentally expected levels of performance and are helpful to compare with other age-only corrected scores (e.g., IQ). Finally, fully demographically adjusted scores are interpreted as an individual’s neurocognitive functioning compared to a demographically comparable peer, and is the best indicator of possible deviations from expected levels of normal performance for a given individual (i.e., impairment).
The fully corrected scores were of particular interest given the complexities involved in their creation and since these scores are most applicable in neuropsychological contexts (i.e., determining impairment from previous levels of functioning). Our fully corrected normative parameters demonstrated 1 standard deviation (SD) impairment rates ranging from 13.4% to 17.9% across the child and adult NIHTB-CB tests and Composites. Given that we based our corrections on the normal curve, which estimates approximately 16% of the population will fall 1 SD below the mean, our normative corrections are commensurate with expectations for a normal distribution. Of note, these cut-points were created separately for each racial/ethnicity group and separately for children and adults. These standards, therefore, account for the performance differences across race/ethnicity cohorts, while correcting for other demographic factors (e.g., as in Norman et al., Reference Norman, Moore, Taylor, Franklin, Cysique and Ake2011).
When we compared our newly created fully corrected scores to those based on the original NIHTB-CB norms, there were several distinct differences. At the continuous level, the old and new NIHTB-CB T-scores demonstrated similarities (e.g., strongly correlated), but within-subjects analyses showed that the original scores differed from the new scores on average by over half a standard deviation, and ranged up to an almost three standard deviation difference on some of the Composites. Most importantly, the original norms demonstrated residual demographic associations with a majority of the NIHTB-CB performances that were accounted for by our new norms. Given that the original normative standards did not wholly account for demographic effects, those scores may result in under- and/or over-estimations of deviations from expected performances (e.g., the over-corrections for age and education in children observed would result in artificially lower scores among children with higher ages and mothers’ educations).
However, there are also several limitations in these newly developed normative standards. First, although the fully corrected NIHTB-CB scores adjust for each demographic factor and its confounding effect on one another within racial/ethnicity groups, our current norming program does not allow for interaction terms among the demographics. We did observe one significant interaction between age and education on the Crystallized Composite for the adult White/Asian group that we were, therefore, unable to account for; future studies would benefit from the development of normative programs that may adjust for these complex relationships. Additionally, given that we did develop norms for children and adults per racial/ethnicity group, some norming groups had fairly small sample sizes (e.g., adult Hispanics n=100). Therefore, caution in interpreting norms based upon those smaller cohorts may be warranted due to possible limitations in the representativeness of the examined subgroup. However, we believed it was important to provide normative standards for as many race/ethnic groups as possible to achieve some estimates of how these individuals performed on the NIHTB-CB. Of note, many other potentially important background factors were not consistently assessed in the normative study and, therefore, could not be considered in the demographic corrections. We have outlined some of the important language background descriptors in Table 1 to increase interpretation of how well the fully adjusted normative samples represent a given individual who presents for testing, especially within the adult Hispanic cohort. Importantly, there is a body of evidence indicating that among individuals with diverse language backgrounds, English proficiency may impact neuropsychological test performances (e.g., Mungas et al., Reference Mungas, Reed, Haan and Gonzalez2005) and should, therefore, be considered in test interpretation. Among our Hispanic adults tested in English, the large majority indicated speaking English and being educated and born in the United States; however, only approximately half of the group reported learning English as their first language. Within our normative data, there were no significant associations between the language/background factors and the NIHTB-CB Composites among the Hispanic adults; however, Hispanics who reported having at least some of their education being outside of the United States (n=9) did show a trend toward having poorer Crystallized Composite T-scores than those educated in the United States (Cohen’s d=0.56). Therefore, although these background characteristics may be representative of Hispanic adults in the United States, they can still importantly impact test scores and should be considered when applying these normative standards. Additionally, there were many other significant background variables that may impact test scores and were not systematically assessed, including socioeconomic status, bilingualism, country of origin (for immigrants), and acculturation. These factors should still be considered when interpreting data for such individuals from diverse backgrounds. Lastly, the participants within our normative samples self-identified race/ethnicity, which can carry inherent problems (e.g., perceived racial or cultural group versus genetic or geographic origins). However, self-report is the gold standard for race/ethnicity identification according to the 2010 U.S. Census and in agreement with the U.S. Office of Management and Budget guidelines. Self-identification is also representative of how these factors will likely be assessed among investigators and clinicians using the NIHTB-CB, and, therefore, further supports the generalizability of our normative standard cohorts.
In summary, the NIHTB-CB normative standards presented here differ in important conceptual and methodological ways from those norms originally created for the NIHTB-CB. The NIH Toolbox initiative plans to incorporate these presented normative standards into the NIHTB-CB online scoring program; however, they are not currently available online and thus, in the interim, they will be made available for use via an Excel program that can be obtained by emailing the authors. Given the complexity of the normative formulas (presented in online Appendix 2), the authors recommend that users rely on the Excel spreadsheet (with embedded formulas) instead of independent application of the formulas. Moving forward, application of these normative standards on NIHTB-CB performances among various brain-injured populations is warranted to provide evidence of discriminative validity. The NIHTB-CB can be accessed at www.nihtoolbox.org.
Acknowledgments
The Original NIH Toolbox development contract and adult norming was supported by Blueprint for Neuroscience Research and the Office of Behavioral and Social Sciences Research, National Institutes of Health, under Contract No. HHS-N-260-2006-00007-C. The child and parent norming (includes some of the data used here for adults) was supported by Health Measurement Network for the National Children’s Study. National Institutes of Health– NICHD, HHSN267200700027C. This work was also supported by the National Institute for Health grants F31-DA035708 and (in part) by a Foundation for Rehabilitation Psychology Dissertation Award. There are no conflicts of interest to report.
Supplementary material
To view supplementary material for this article, please visit http://dx.doi.org/10.1017/S1355617715000351.


