


Introduction
Almost 19 % of youth (2–19 years old) were obese in 2015–2016, and 14⋅8 % of high school students (grades 9–12) were obese in 2017(Reference Hales, Carroll and Fryar1,Reference Kann, McManus and Harris2) . Childhood obesity can lead to negative psychosocial, neurological, pulmonary, cardiovascular, gastrointestinal, endocrine, renal and musculoskeletal consequences(Reference Sahoo, Sahoo and Choudhury3). Obese children can be stigmatised by peers, family and other adults in their life, and often have a lower quality of life than peers of a healthy weight(Reference Beck4). Obesity can result in the early onset of puberty in girls(Reference Li, Liu and Deng5), and overweight and obesity are associated with poor levels of academic achievement(Reference Wu, Chen and Yang6). Thus, successful interventions in childhood and adolescence are needed to reduce the risks associated with overweight and obesity.
Overweight and obesity-related interventions often begin with the assessment of and overall risk status of participants(Reference Natale, Scott and Messiah7,Reference Beechy, Galpern and Petrone8) . Some methods of assessing body fat and composition include total body water, total body potassium, bioelectrical impedance analysis, dual-energy X-ray absorptiometry and body mass index (BMI)(Reference Beechy, Galpern and Petrone8). BMI (the ratio of weight in kilograms to height in metres squared) is the most common method of assessing obesity prevalence in population studies(Reference Beechy, Galpern and Petrone8,Reference He, Cai and Fan9) . BMI can objectively be measured by trained researchers or self-reported by participants to estimate outcomes in health-related interventions(Reference Beechy, Galpern and Petrone8,Reference Yoshitake, Okuda and Sasaki10) . To collect objective measurements, trained personnel are needed, as well as access to accurate and appropriate equipment(Reference Headen, Cohen and Mujahid11). Even though collecting objective measures of BMI tends to be most accurate, it may not be feasible in larger studies or programmes due to cost, time and available resources(Reference Headen, Cohen and Mujahid11,Reference Drieskens, Demarest and Bel12) . Self-reported measures, however, are generally practical, low cost, quick and easy to collect, and may provide benefits in sampling, recruitment and data collection, particularly for large populations(Reference He, Cai and Fan9–Reference Headen, Cohen and Mujahid11). Self-reported height and weight have been used to define BMI in college students and adults in instances where objectively measured values are not feasible(Reference Vargas, Flores and Robles13,Reference Anderson and Good14) .
However, some research suggests that self-reported measurements are liable to biases that may arise from either individual bias in reporting behaviour or systematic differences in the type of survey used in the study(Reference He, Cai and Fan9,Reference De Rubeis, Bayat and Griffith15) . Some sources of bias may include socio-economic status, body image perceptions and health-related behaviours such as physical inactivity and substance use(Reference Chau, Chau and Mayet16). In addition, gender may be a factor in differing reporting of height and weight. For example, females underreported their weight more than males in one study that examined self-reported height, weight and BMI in children and adolescents(Reference Yoshitake, Okuda and Sasaki10). Pursey et al. also found that females underestimated their weight more than males, and that self-reported height was statistically different for both genders when examining young adults(Reference Pursey, Burrows and Stanwell17). Zhou et al. (Reference Zhou, Dibley and Cheng18) examined the accuracy of self-reported weight, height and resultant BMI values in Chinese adolescents (aged 12–16) and observed wide discrepancies in self-report and objectively measured variables. These discrepancies were influenced by the area of residence, age and BMI category but not gender(Reference Zhou, Dibley and Cheng18). Regardless of potential biases, many studies reported that using self-reported measures were valid proxies for when collecting objective measures were not feasible(Reference He, Cai and Fan9,Reference Yoshitake, Okuda and Sasaki10,Reference Kee, Lim and Sumarni19) . Yet, some caution the discrepancies may impact outcomes and correction factors should be applied, when able(Reference Headen, Cohen and Mujahid11,Reference Drieskens, Demarest and Bel12) .
Self-reported data may provide an understanding of adolescent obesity, its correlates, precursors and impacts(Reference Chau, Chau and Mayet16). Though there is research on the relationship between self-reported and objectively measured height and weight in some adolescent populations, the evidence is not necessarily generalisable to the USA as most recent studies have been conducted outside of the USA or were conducted in one isolated location in the USA(Reference Zhou, Dibley and Cheng18–Reference Pérez, Gabriel and Nehme22). In addition, studies that were conducted in larger, more diverse samples were done in the early 2000s, warranting updated studies to explore whether trends of reporting measurements have changed(Reference Brener, Eaton and Lowry23,Reference Brener, McManus and Galuska24) . Further research is needed to compare the accuracy of self-reported data with objectively measured height, weight and BMI in large adolescent populations(Reference Olfert, Barr and Charlier25). Thus, the aims of the present study were to examine the accuracy of self-reported height, weight and resultant BMI values, and to describe gender differences in the level of agreement between objectively measured and self-reported values in a sample of high school students in different U.S. states.
Methods
The present study was part of the Get Fruved project, a health and wellness initiative that aimed to prevent unwanted weight gain in college and high school students. During the high school development phase, researchers at four U.S. universities recruited and objectively measured height and weight of participants at five high schools. Each university recruited students in-person, through email correspondence and flyers. To be eligible, participants only had to be students of the participating high school. The study took place over 6 months to ensure a large sample size was obtained.
Study/survey procedures
Participants reported their heights and weights prior to being measured by researchers. Once self-reported measurements were provided by the participant, objectively measured height and weight were collected as the gold standard reference for comparison. The Get Fruved project had a standard protocol for collecting anthropometric measurements, and lead trainers at each location trained researchers on this protocol(Reference Barr, Colby and Riggsbee26). Each researcher had to meet 80 % inter-rater reliability with the lead trainer during training sessions. Each measurement was taken twice and had to be within 0⋅2 kg and 0⋅2 cm for weight and height, respectively; otherwise, a third measurement was taken and the two measures within the specified range were entered. The mean of the two measurements was calculated for use in the study. The researchers entered all measurements into a secure platform, Qualtrics (Qualtrics, Provo, UT, USA). The technical error of measurement (TEM), the relative technical error of measurement (rTEM) and the coefficient of reliability (R) were calculated to assess the precision of the researchers that collected measurements. Height and weight revealed a TEM of 1⋅22 cm and 0⋅55 kg, respectively. The lower the TEM, the better the precision of the researcher(Reference Ulijaszek and Kerr27). The rTEM for height and weight were 0⋅73% and 0⋅82%, respectively. A rTEM less than 2% is considered acceptable(Reference Ulijaszek and Kerr27). The R for height and weight were 0⋅99 and 0⋅98, respectively. A value of over 0⋅95 is considered acceptable(Reference Ulijaszek and Kerr27). Precision of the researchers was deemed acceptable for this study. Prior to participating in the study, participants were provided with an assent form to read and sign. Only participants who assented for their data to be used and who had parental consent for their data to be used were included in analysis. This study was conducted according to the guidelines laid down in the Declaration of Helsinki, and all procedures involving human subjects were approved by the University of Tennessee Institutional Review Board (UTK IRB-14-09366 B-XP).
Statistical analysis
Descriptive statistics were used to describe participant characteristics, such as age, gender, race and ethnicity, and state of residence. Continuous BMI scores were categorised (underweight, normal, overweight or obese) using BMI-for-age percentile, which was calculated using the Centers for Disease Control and Prevention's Children's BMI Group Calculator – Metric Version in Excel. Participants below the 5th percentile were categorised as underweight, between the 5th and 85th percentile were normal, 85th–95th percentile were overweight, and 95th or greater percentile were obese(28). Two BMIs were calculated for each participant: one from self-reported height and weight and the other from the objectively measured height and weight by a trained researcher.
Pearson's correlation was used to understand the strength of the relationship between self-reported and objectively measured values. Even though Pearson's correlation is not the most appropriate method of correlation for this study, it was only included for comparison to other studies(Reference Pérez, Gabriel and Nehme22,Reference Looney29) . Lin's concordance correlation coefficient (CCC) is considered more appropriate and was used to measure precision and accuracy between self-reported and objectively measured BMI, height and weight(Reference Lin, Hedayat and Wu30). Regression models were used to explore relationships of self-reported and objectively measured height, weight and continuous BMI scores with and without gender. Limits of agreement (LOA) analyses were conducted using the Bland–Altman method(Reference Bland and Altman31). Bland–Altman plots were created for the overall sample, females and males to visually assess the agreement between BMI, height and weight. These visuals plot the difference of self-reported and objectively measured values against the mean of self-reported and objectively measured values to visually assess agreement(Reference Bland and Altman31). Absolute mean differences (self-reported values minus objectively measured values) were calculated for each group's BMI, height and weight. The LOA was calculated by adding and subtracting the absolute mean difference's 95 % confidence interval to the absolute mean difference. In addition, paired sample t-tests were used to explore absolute mean differences between self-reported and objectively measured values.
An assessment of BMI category between self-reported and objectively measured values was conducted using weighted κ coefficients between gender, race and ethnicity, and state of residence(Reference Agresti32). Values are considered to have almost perfect agreement between 0⋅81 and 0⋅99, substantial agreement between 0⋅61 and 0⋅80, moderate agreement between 0⋅41 and 0⋅60, fair agreement between 0⋅21 and 0⋅40, slight agreement between 0⋅01 and 0⋅20, and less than chance agreement <0(Reference Viera and Garrett33). To assess how accurately participants in different BMI categories provide data to be placed in the correct category, frequency and percent of self-reported v. objectively measured BMI categories were presented. Considering each BMI category as the case of interest, the objectively measured BMI was used to classify participants, and sensitivity and specificity were calculated for each BMI category to assess the performance of self-reported measures v. objective measurements. Sensitivity was calculated by taking to the total cases that accurately reported the same category of their objective BMI category divided by the total number of objectively measured cases in that category(Reference Genders, Spronk and Stijnen34). Specificity was calculated by taking to the total number of cases that accurately reported not to be in the respective BMI category by the total number of cases that reported not to be in that category(Reference Genders, Spronk and Stijnen34). Sensitivity determines the proportion of correctly identified actual positives (cases), whereas specificity determines the proportion of correctly identified negatives (non-cases)(Reference Zhou, Dibley and Cheng18). To assess the accuracy of self-reporting height and weight to be classified into the correct BMI category, frequencies and percentages of those who underreported, accurately reported and overreported were presented for males, females and each BMI category. Pearson's χ 2 test was used to assess discrepancies of expected BMI classification. All analyses were performed with Excel, R (version 4.0.0 for Windows, Vienna, Austria) and SPSS (Version 24.0. Armonk, NY), and the level of significance was P < 0⋅05.
Results
A sample of 425 participants had both objectively measured and self-reported heights and weights collected. Five participants who had implausible values for either self-reported height and/or weight were removed from analysis. Since gender was a primary variable of interest, only participants that identified as either male or female were included in analysis. Eight participants were then removed for selecting their gender identity as ‘other,’ ‘choose not to answer’ or did not answer at all. This left a total sample of 412 participants.
Participants were almost evenly split by sex (51⋅0 % were female), most identified as non-Hispanic white (50⋅4 %) and the largest percentage of the sample was from the state of Florida (46⋅6 %) (Table 1). The mean age of participants was 16⋅3 (±7⋅1 sd) years, and most (70⋅8 %) participants were in the normal BMI category(28). Each characteristic had substantial agreement (range 0⋅64–0⋅77)(Reference Viera and Garrett33). Participants from South Dakota had the least agreement among the demographic characteristics (K 0⋅64, P < 0⋅001) and individuals from Tennessee had the most agreement (K 0⋅77, P < 0⋅001).
Table 1. Characteristics of high school participants

Abbreviations: BMI: body mass index; sd: standard deviation; kg: kilograms; cm: centimeters.
* Weighted κ used. All coefficients are significant (P < 0⋅001).
The Pearson's correlations between self-reported and objectively measured BMI, height and weight were strong (r 0⋅75, 0⋅86 and 0⋅84, respectively)(Reference Mukaka35). Lin's CCC between self-reported and objectively measured BMI, height and weight was highly concordant (ρ c 0⋅86, 0⋅81 and 0⋅92, respectively)(Reference Lipsky, Haynie and Hill36). Regression analysis suggested that when predicting the objective height and weight using self-reported values, gender was insignificant in predicting height (P = 0⋅875) and was marginally significant for weight (P = 0⋅057). However, regression analysis found that when predicting objective BMI using self-reported values, gender is a significant factor (P = 0⋅010), and the interaction term between gender and self-reported BMI was also significant (P = 0⋅011). This indicated that when predicting objective BMI using self-reported values, the different gender groups will likely have different slopes and intercepts.
The differences of self-reported and objectively measured values (for BMI, height and weight) were plotted against the mean of the two values for the overall sample, females and males (Figs. 1–3, respectively). The LOA, which is the 95 % confidence interval of the mean difference, was considered to have ‘good’ agreement if it was within 1 standard deviation (sd) of the mean of the objectively measured value, ‘fair’ agreement if within 2 sd and ‘poor’ agreement if within 3 sd(Reference Yoshitake, Okuda and Sasaki10). The LOA of BMI was considered fair because it fell within 2 sd of the mean of objectively measured BMI for the overall sample, females and males (±8⋅67sd, ±8⋅37sd and ±8⋅98sd, respectively) (Table 2). For height, the LOA was considered good as each fell within 1 sd of the objectively measured mean of height for the overall sample, females and males (±9⋅62sd, ±6⋅68sd and ±7⋅70sd). The LOA for weight was considered to have good agreement for the overall sample and males due to falling within 1 sd of the objectively measured mean of weight (±14⋅98sd and ±15⋅86sd, respectively), but females had fair agreement due to falling within 2 sd of the objectively measured mean of weight (±23⋅38sd). Negative absolute mean differences indicated that BMI and weight were underreported in all groups, and the paired sample t-tests revealed that they all differed significantly (P < 0⋅001). For height, positive absolute mean differences revealed all groups overreported values, and paired sample t-tests revealed the overall sample and males differed significantly (P < 0⋅001), but females did not (P = 0⋅108).

Fig. 1. Bland–Altman plots of the difference v. the mean of self-reported and measured (a) body mass index (BMI), (b) height and (c) weight for the overall sample. Red line, mean difference between self-reported and measured data. Green lines, 95 % limits of agreement (1⋅96 sd).

Fig. 2. Bland–Altman plots of the difference v. the mean of self-reported and measured (a) body mass index (BMI), (b) height and (c) weight for female participants. Red line, mean difference between self-reported and measured data. Green lines, 95 % limits of agreement (1⋅96 sd).

Fig. 3. Bland–Altman plots of the difference v. the mean of self-reported and measured (a) body mass index (BMI), (b) height and (c) weight for male participants. Red line, mean difference between self-reported and measured data. Green lines, 95 % limits of agreement (1⋅96 sd).
Table 2. Limits of agreement for measured and self-reported BMI, height and weight

Abbreviations: sd: standard deviation; LOA: limits of agreement; BMI: body mass index; kg: kilograms; cm: centimeters.
a Absolute mean differences (self-reported − measured).
b LOA is 95 % confidence interval of the absolute mean difference.
c Agreement was considered ‘good’ if the LOA was within 1 sd of the measured mean, ‘fair’ if within 2 sd and ‘poor’ if within 3 sd.
* Paired t-test was calculated.
When continuous BMI values were categorised, most participants (94⋅0 %) that reported height and weight values to be in the normal BMI category were objectively measured for this category (Table 3). Sensitivity decreased as BMI increased from healthy to overweight to obese (94⋅0, 60⋅4 and 50⋅0 %, respectively); and specificity increased as BMI increased from healthy to overweight to obese (79⋅2, 91⋅1 and 99⋅0 %, respectively).
Table 3. Comparisons between self-reported and measured BMI categories
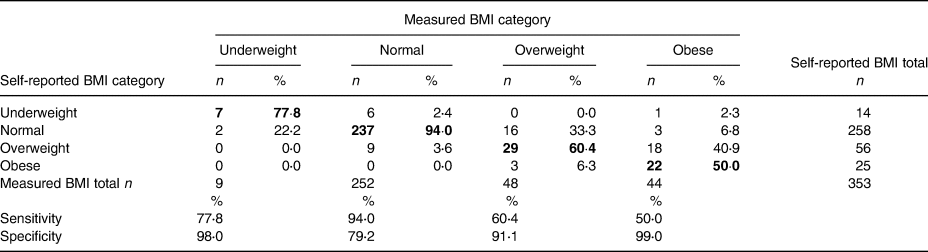
Abbreviations: BMI: body mass index. Bolded values indicate frequency and percentage of participants that accurately reported their BMI to be correctly categorised in the correct BMI category.
Most participants (83⋅6 %) accurately reported their height and weight enough to be categorised in the same BMI category as their objectively measured BMI (Table 4). Pearson's χ 2 tests revealed that females more accurately reported BMI than males (87⋅3 v. 79⋅7 %, respectively). In addition, males had a higher percentage of overreporting BMI category than females (16⋅9 v. 8⋅3 %, respectively). Differences between gender and BMI categorisation were close to significant (P = 0⋅050). Regarding BMI category and reporting, Pearson's χ 2 revealed significant reporting differences between BMI categories (P < 0⋅001). Those who were measured to be in the overweight or obese category had a higher than expected cell count for underreporting (33⋅3% and 50.0 % underreported, respectively), and those who measured to be in the normal weight category had a higher expected cell count for accurately reporting (94⋅0 % accurately reported). This indicated that those in the overweight or obese category were more likely to underreport their self-reported BMI to be placed in the incorrect BMI category.
Table 4. Accuracy of self-reported measures to be classified in the measured BMI category

Abbreviations: BMI: body mass index.
* Pearson's χ 2 between groups of variables and BMI classification accuracy.
Discussion
Correlations of BMI, height and weight were strong and concordant for the overall sample. The LOA between self-reported and objectively measured BMI was fair for the sample and by each gender. Kappa was substantial for the overall sample and when measures were stratified by gender, race and ethnicity, and location. Most participants accurately reported their height and weight to be categorised in the correct BMI category. Gender differences occurred in reporting height and weight, and those who were objectively measured to be in the overweight or obese category were less accurate in self-reporting height and weight than their normal weight counterparts.
The overall sample had a strong correlation and concordance for BMI, height and weight. Though Pearson's correlation in the present study was lower than was found in another study which assessed the agreement of self-reported height and weight in adolescents(Reference Yoshitake, Okuda and Sasaki10), correlations were similar to a study on emerging adults and slightly higher than pooled correlations found in a meta-analysis of fifteen studies(Reference Lipsky, Haynie and Hill36,Reference De Rubeis, Bayat and Griffith37) . Lin's CCC also fell in the ranges presented in the study with emerging adults(Reference Lipsky, Haynie and Hill36). Concordance was higher for weight and BMI, and lower in height, which was similar to another study on adolescents that used Lin's CCC to assess concordance(Reference Pérez, Gabriel and Nehme22).
Height was overreported and weight was underreported, leading to slight underreporting for BMI in the overall sample. This finding is in agreement with other studies(Reference Pursey, Burrows and Stanwell17,Reference Maukonen, Mannisto and Tolonen38,Reference Seijo, Minckas and Cormick39) . Visually, the Bland–Altman plot showed the higher the BMI, the less agreement among values. This was visually assessed as similar in other studies(Reference Yoshitake, Okuda and Sasaki10,Reference Zhou, Dibley and Cheng18,Reference Villarini, Acito and Gianfredi40) . The overall sample's LOA were larger for weight and BMI, and smaller for height than a study conducted by Zhou et al. (Reference Zhou, Dibley and Cheng18) By using its study's specified criteria for the strength of agreement, Zhou et al. concluded that all three measures were unacceptable, especially BMI(Reference Zhou, Dibley and Cheng18). The present study used another a priori criteria for agreement presented by Yoshitake et al. (Reference Yoshitake, Okuda and Sasaki10) In the study by Yoshitake, the authors concluded that BMI, height and weight were regarded as acceptable due to falling within 1 sd of the objectively measured mean(Reference Yoshitake, Okuda and Sasaki10). In the present study, height and weight were considered to have good agreement, but BMI did not fall within the 1 sd for good agreement. Another study had similar overall strength of agreement for BMI, height and weight as the present study, and its authors also reported the values to have fair agreement(Reference Pursey, Burrows and Stanwell17). When assessing weighted κ statistics for BMI categories, one study by Kee et al. (Reference Kee, Lim and Sumarni19) had a κ of 0⋅76, which was only slightly higher than the overall sample's κ in this study (0⋅71), both indicating substantial agreement between self-reported values and BMI categorisation.
The regression models found gender differences in predicting BMI, which warranted further analyses. The present study found that both females and males significantly underreported weight, but only males significantly overreported height. This is contrary to an earlier study conducted in the USA by Brener et al., which found that only female adolescents were more likely to underestimate their weight(Reference Brener, McManus and Galuska24), and another study by Pursey et al. which was conducted in Australia(Reference Pursey, Burrows and Stanwell17), justifying conducting updated studies in the USA to measure agreement and accuracies of self-reported height and weight in adolescents. The findings of the present study also contradicted Pursey et al.'s finding that found differences in height between self-reported and objectively measured height were significant for both males and females(Reference Pursey, Burrows and Stanwell17). In a literature review on self-reported and objectively measured comparison studies in adults, height was overreported for both sexes and underreported for weight and BMI(Reference Maukonen, Mannisto and Tolonen38). The LOA analysis suggested that BMI for both males and females had only fair agreement, and height had good agreement. However, male weight had good agreement, but female weight had fair agreement. Two other studies in adolescents found similar mean differences and LOA for BMI, height and weight(Reference Zhou, Dibley and Cheng18,Reference De Vriendt, Huybrechts and Ottevaere41) . While they both concluded that agreement was fair on a population level, it was deemed unacceptable on an individual level(Reference Zhou, Dibley and Cheng18,Reference De Vriendt, Huybrechts and Ottevaere41) . When BMI was categorised, the present study found females to have higher agreement than males. This was different from a previous study conducted by Yoshitake et al. that found the opposite between genders(Reference Yoshitake, Okuda and Sasaki10). The finding in the present study was supported by more females accurately reporting height and weight to be categorised in the accurate BMI category. This may be due to the overestimation of reported height by males previously reported. Discrepancies in height measurements impact BMI classification more than weight(Reference Quick, Byrd-Bredbenner and Shoff42). Many different factors may have led to males and females both underreporting their weight. In a study by Rasmussen et al., females who underestimated weight had not been recently weighed, either at a doctor's office or did not weigh themselves(Reference Rasmussen, Holstein and Melkevik20). In addition, the same study found that both males and females had low recall ability(Reference Rasmussen, Holstein and Melkevik20).
When assessing differences in reporting between BMI category, the present study had similar findings to other studies(Reference Drieskens, Demarest and Bel12,Reference He, Cai and Fan21,Reference Pérez, Gabriel and Nehme22,Reference Maukonen, Mannisto and Tolonen38) . Overweight and obese participants misreported height and weight more to be placed in incorrect BMI categories, where normal weight participants had high accuracy. A meta-analysis conducted by He et al. found that individuals who were overweight and obese were less accurate in BMI classification as well(Reference He, Cai and Fan21). However, one study found a high agreement of BMI categorisation among overweight children(Reference Yoshitake, Okuda and Sasaki10). Sensitivity analysis found that as BMI increased from normal to obese, sensitivity decreased, which supports the inaccuracies of BMI in overweight and obese individuals. A study in the USA found the sensitivity of obese adolescents ranged from 70⋅8 to 81⋅9 %, which was considerably higher than the 50⋅0 % found in this study(Reference Pérez, Gabriel and Nehme22). Additionally, specificity analysis in the present study found that as BMI increased, specificity did as well, which was in accordance with expectations. Several studies suggested that weight underestimation may be associated with increased BMI in an adult population(Reference Drieskens, Demarest and Bel12,Reference Maukonen, Mannisto and Tolonen38,Reference Quick, Byrd-Bredbenner and Shoff42) . This was supported in our study which found high inaccuracies of BMI categorisation and decreased sensitivity as BMI increased.
When comparing κ statistics among participant characteristics, location provided the most variability in reliability between measures. South Dakota participants had the lowest agreement of BMI category, but Tennessee had the highest. In the study by Zhou et al., the researchers found that the area of residence was a factor in BMI misclassification in participants, which supports this discrepancy(Reference Zhou, Dibley and Cheng18). Interestingly, a study conducted by Olfert et al. assessed the agreement of measurements in college students and found that participants from South Dakota had one of the highest agreement values over other states in the sample (which included states represented in this study)(Reference Olfert, Barr and Charlier25). Why adolescents from South Dakota do not report height and weight as accurately as other U.S. states warrant further examination.
Previous studies that examined differences between self-reported and objectively measured BMI, height and weight, showed mixed results on whether self-reported measurements were an adequate proxy for objective measurements(Reference Zhou, Dibley and Cheng18,Reference He, Cai and Fan21) . Findings seem to vary across location, which in one study found North America self-reported measures to be more biased than in Asia(Reference Maukonen, Mannisto and Tolonen38). This study found lower agreement when using continuous values of BMI than categorizing the values into BMI categories (underweight, normal weight, overweight and obese). Thus, the authors caution future studies with U.S. adolescents against using continuous BMI variables over BMI categories, especially in smaller studies. This conclusion is consistent with other adolescent BMI agreement studies(Reference Zhou, Dibley and Cheng18,Reference De Vriendt, Huybrechts and Ottevaere41) . One way to mitigate the low agreement may be to implement a corrective factor to improve agreement between measures, which has been done in other comparison studies(Reference Drieskens, Demarest and Bel12,Reference Pérez, Gabriel and Nehme22) .
Limitations of this study included not assessing factors that may have led to height and weight misreporting as other studies did(Reference Chau, Chau and Mayet16,Reference Rasmussen, Holstein and Melkevik20) . One study found that body image perception and socio-economic status were predictors of misreporting(Reference Chau, Chau and Mayet16). In addition, though participants were from four states across the USA, it was not racial or ethnically diverse as the majority of students identified as non-Hispanic white. Therefore, results cannot be generalised to the U.S. adolescent population. Regardless, assessing participants from four states increases the strength of this study as BMI agreement levels were found to be different between states.
Conclusion
Overall, a reasonable agreement between BMI classification in adolescents with objective and self-reported measures was found; however, further research is needed to explore regional differences in self-reported measurements. In addition, a more diverse sample should be utilised to make results more generalisable to the U.S. population. This study found greater agreement when height and weight were calculated to be placed in a BMI category than when used as a continuous variable; therefore, categorizing BMI is recommended for the adolescent population. Future research could focus on creating an algorithm to correct BMI misclassification to improve accuracy for self-reported data in adolescent studies.
Acknowledgments
This work was supported by the National Institute of Food and Agriculture, U.S. Department of Agriculture (award no. 2014-67001-21851). The funders had no role in the design, analysis or writing of this article.
C.A. managed and carried out data collection for this study, led and conducted data analysis, and led manuscript writing. S.C. was responsible for leading the overall study from which this project originated, formulated the research question, contributed to manuscript writing and revisions, and assisted in obtaining funding for the study. A.O-A. carried out data collection for this study, contributed to manuscript writing and revisions, and guided and provided feedback on the analysis and interpretation of the results. T.K. supported carrying out of data collection, contributed to manuscript writing and revisions, and assisted in obtaining funding for this study. K.K. supported carrying out of data collection, contributed to manuscript writing and revisions, and assisted in obtaining funding for this study. M.D.O. supported carrying out of data collection, contributed to manuscript writing and revisions, and assisted in obtaining funding for this study. W.Z. contributed to analysis, guided and provided feedback on the analysis and interpretation of the results, and contributed to manuscript writing and revisions.


 Open access