


Autism is a neurodevelopmental disability that is characterised by deficiencies in social reciprocity and language skills that are associated with repetitive behaviours and restricted interests( Reference Eigsti and Shapiro 1 ). The incidence of autism has rapidly increased since the 1970s. According to reports, the prevalence rates are approximately 4·1 cases per 1000 children in Australia( Reference Charles, Harrison and Britt 2 ) and 6·5 cases per 1000 children in Canada( Reference Fombonne, Zakarian and Bennett 3 ), which are consistent with the prevalence estimates from the USA and the UK for several years( Reference Bertrand, Mars and Boyle 4 – Reference Fombonne 7 ). Although nationwide epidemiological data on children with autism are not available in China, several regional studies have suggested that the prevalence of autism is 1·1–2·3 per 1000 children( Reference Zhang, Ji and Li 8 – Reference Wang, Zhai and Zheng 11 ). Children with autism are frequently observed to have peculiar eating habits that result from the connatural disease characteristics( Reference Cascio, Foss-Feig and Heacock 12 ). Although studies on nutrient intake of children with autism have shown conflicting results( Reference Xia, Zhou and Sun 13 – Reference Lockner, Crowe and Skipper 15 ), most studies have reported that the dietary intake of children with autism is less than the recommended amounts of some minerals and vitamins( Reference Dosman, Drmic and Brian 16 , Reference Lindsay, Eugene and Aman 17 ). They may also select fewer food categories( Reference Schreck, Williams and Smith 18 ), which may jeopardise their nutritional status, compared with that in children without autism( Reference Xia, Zhou and Sun 13 ). Moreover, a high prevalence of gastrointestinal ailments may aggravate the digestive and absorption functions among children with autism( Reference Wakefield, Anthony and Murch 19 , Reference White 20 ). The interaction between different genetic backgrounds and nutrients may also result in different metabolic models and utility levels of nutrients, regardless of the same quantity and quality of food intake( Reference Berry and Hyppönen 21 , Reference Cahill and El-Sohemy 22 ). Therefore, appraisal of the nutritional status of children with autism should not be based solely on their dietary intake.
In Heilongjiang Province, located in the northeast region of China, the economic condition is not as thriving as that in the southern part of the country. Thus, malnutrition in the children in this area is more common, for example vitamin A, Ca and Zn deficiencies( Reference Wei, Xiujuan and Shufen 23 ). In the present study, we hypothesised that children with autism in this area have inadequate nutrient intake and lower serum micronutrient level than children who underwent normal developmental stages based on a cross-sectional case–control study. We also assessed whether or not the poor nutritional state is associated with anthropometric data and clinical symptoms of nutrient deficiencies, given that these factors may have important implications in nutritional management of children with autism.
Materials and methods
Participants
A total of fifty-three children with autism (forty-five boys and eight girls; aged 4–6 years) who visited the Children Development and Behavior Research Center of Harbin Medical University (Harbin, China) from November 2009 to June 2011 were included in this study. Diagnosis was based on the criteria for autism defined in the Diagnostic and Statistical Manual of Mental Disorders, Fourth Edition (DSM-IV) as well as on a childhood autism rating scale score of thirty according to a diagnostic interview conducted by a developmental paediatrician. The exclusion criteria included Asperger's disorder, pervasive developmental disorder, chronic seizures and recent infection as well as the use of any nutritional supplements. The study also recruited fifty-three children considered to be typically developing children from nursery schools around the Harbin Medical University. These participants were typically developing children who, according to their parents, had not experienced delays in motor and language development or behavioural problems. These children matched the age bracket (within 4 months), sex, occupations of parents and family economic status of the enrolled children with autism. All of the participants were of Han ethnicity.
This study was conducted according to the guidelines stated in the Declaration of Helsinki. All the procedures that involved human subjects were approved by the Research and Ethics Committee of Harbin Medical University. Written informed consent was obtained from the parents of each participant prior to enrolment.
General condition survey
The parents of the children with and without autism completed the questionnaire in which information regarding the children's eating behaviour, gastrointestinal symptoms and general condition was obtained. Before the survey was conducted, we calculated Cronbach's α coefficients to estimate the reliability of the reported factors in the questionnaire (α coefficients >0·70).
The questionnaire survey was conducted through face-to-face interviews between the investigators and the parents of both groups. The following data were obtained from the questionnaire: name, age, date of birth, birth condition, eating habits (such as food selectiveness (fastidious about their food), resisting trying new foods (refusing to eat those foods not tried before), eating independence and attention (the eating time for a meal is more than 30 min)), gastrointestinal ailments (such as abdominal pain (gastrospasm or enterospasm), constipation (reduced defecation frequency, decreased faeces, dry stool, need great effort to defecate), chronic diarrhoea (increased defecation frequency and loose stools for more than 2 months), excessive flatulence (often hiccup or pass gas) and disgorging), sleep status, food or drug allergies, self-injurious behaviour, tantrums, aggression, oppositional behaviour, family information, etc.
Dietary assessment
The parents of each subject were requested to provide a 3 d food diary of their children for two weekdays and one weekend (covering the consumption over 24 h on each of the 3 d). A picture booklet that includes local consumed food types, food pictures, the proportion of a serving and the estimated weight was handed out to the parents of each participant so that they could qualitatively and quantitatively describe all types of food consumed by their children and estimate the food intake.
A registered dietitian analysed the 3 d diet diaries by using the nutrient calculator software (Fei Hua V2.3, The Institute for Nutrition and Food Security, Chinese Center for Disease Control and Prevention). The study used the dietary reference intakes (DRI), including the recommended nutrient intakes and the adequate intakes recommended by the Chinese Nutrition Academy (2000), as norms for individual intake( 24 ). Results were converted to recommended nutrient intakes or adequate intakes percentages for energies and various nutrients per day based on DRI with respect to the age group. In this study, ‘sufficient intake’ is defined as ≥100 % of the DRI, ‘borderline intake’ corresponds to 80–99 % of the DRI and ‘inadequate intake’ indicates <80 % of the DRI.
Detection of the biochemical index for nutritional levels
Fasted blood samples (5 ml) were obtained from the participants through venipuncture. Approximately 1 ml of blood was collected and placed into an EDTA-coated tube for Hb determination (Hb automatic blood cell analyser, Sysmex Corporation). The remaining blood was centrifuged. Fe, Zn and Ca in the serum were separated by flame atomic absorption spectroscopy (AA6300 C atomic absorption spectrophotometer, Shimadzu) at 248·3, 213·9 and 422·7 nm, respectively, by using various hollow cathode lamps (Perkin-Elmer). Vitamin A was determined with the HPLC technique according to Miller's method( Reference Miller and Yang 25 ) (Waters 2960 Instrument). Vitamin B12 and folic acid levels were assessed by using a commercial RIA kit (Navy Gen Hospital), in which vitamin B12 and folic acid were labelled with radioactive 57Co and 125I. The values were determined using an automatic GC 911 gamma counter system (USTC Development Corporation).
Physical examinations for malnutrition (undernutrition)
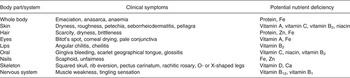
Physical examinations were conducted by trained paediatricians. The examined parts of the body, symptoms and potential underlying nutrient deficiencies are listed in Table 1.
Table 1. Part of the body examined, symptoms and nutrient deficiencies
Anthropometric data
All of the required gauger trainings were completed before the measurement was carried out. Anthropometric data were collected using an HCS-200-RT weightometer and an HGM-200 wall anthropometer (Haerbin Biomedical Company). The accuracy of both instruments was confirmed before use: accuracies for body weight and stature were ±0·1 kg and ±0·1 cm, respectively. The children were examined with light clothing and bare feet. Height and weight values were obtained twice and the averages of height and weight for each child were obtained.
The evaluation of the development status was completed using the standardised WHO procedures( Reference de Onis, Onyango and Van den Broeck 26 ). The height for age, weight for age, BMI for age and weight for height (age <60 months) Z-scores (Z HA, Z WA, Z BMIA and Z WH, respectively) were calculated using the WHO Child Growth Standard (WHO Anthro software, version 3.01)( 27 ). These growth indicators were interpreted according to the Training Course on Child Growth Assessment (Geneva, WHO)( 28 ).
Data analysis
The data on the general condition questionnaire were encoded in a computer by using EpiData V 3.02 software (Chinese Center for Disease Control and Prevention). The study used the Fei Hua (V2.3) nutrient calculator to compute energy and various nutrient intakes per day based on the data from the dietary questionnaire. The χ2 test, two-sample/group t test and Fisher's exact test were used to determine the significance level. The Monte Carlo exact test was also used to evaluate the growth problem distribution of the children in both autism and control groups. P values <0·05 were considered statistically significant.
Results
Participant characteristics
The mean ages of the fifty-three children with autism and fifty-three typically developing children were 59·3 (sd 7·4) (50–78 months) and 59·4 (sd 7·5) (50–79 months) months, respectively. The parents of the children with autism were more likely to report the eating problems of their children (e.g. selectiveness, resisting trying new foods and inability to focus and eat independently compared with the parents of the typically developing children) (P < 0·01; Table 2). Children with autism experienced constipation and chronic diarrhoea to a higher extent and had a family history of allergies or immune diseases (P < 0·001). A higher number of children with autism also exhibited food or drug allergies, self-injurious behaviour, tantrums and aggressive or oppositional behaviour compared with the typically developing children (P < 0·01). No significant differences were observed in other gastrointestinal symptoms and sleep status between the two groups.
Table 2. Comparison of the general condition, eating behaviour, gastrointestinal symptoms, sleep status, agnostic behaviour and family history between children with autism and typically developing children (n 53)
(Number and percentage)

* χ2 test.
Dietary intake
Table 3 summarises the average intake of various nutrients per day of children with autism and those with typical development after the 3 d diet diaries were analysed. Inadequate vitamin A, vitamin B6, Ca and Zn intakes were generally observed in both groups. The mean vitamin C intake was also inadequate for children with autism except for the previously mentioned nutrients. The mean dietary vitamin E, niacin, Mg and Fe intakes were sufficient, whereas the mean dietary vitamin B1, vitamin B2 and folic acid intakes were at the borderline for both groups. The numbers of typically developing children with inadequate dietary vitamin C and Ca intakes were significantly less than those of children with autism (P < 0·05). No statistical differences were found between autism and normally developing groups in terms of the number of children who had sufficient or borderline intakes of other nutrients.
Table 3. Daily intakes of energy and nutrients for autistic and typically developing children, compared with the dietary reference intake (DRI)*, and a comparison of the inadequate intakes (<80 % DRI) of the case and control groups
(Median values and ranges, percentage of recommended nutrient intake (RNI) or adequate intake (AI) and inadequate intake number and percentage)

RE, retinol equivalent; DFE, dietary folate equivalent; NE, niacin equivalent; α-TE, α-tocopherol.
* DRI for the 4–6 years old group recommended by the Chinese Nutrition Society.
† The contribution rate for energy intake.
‡ Significant difference at P < 0·05 (with χ2 tests).
Also, no statistically significant difference in the mean protein, carbohydrates and fat intakes was observed between the two groups. However, the mean contribution of energy intake from dietary fat (27·2 %) in children with autism was lower than the recommended percentage distribution (30–35 % for children aged 4–6 years).
Biochemical determination for nutritional levels
Table 4 shows the results of the biochemical determination for nutritional levels. No significant difference was observed in the Hb contents between children with and without autism. Also, no statistical differences were found in the mean Zn and Fe levels between the two groups, but the mean serum Ca level in children with autism was significantly lower than that in typically developing children (P < 0·01). It is clinically noteworthy that the mean serum Ca level in the autism group and the serum Zn levels in both groups were lower than the reference range. In addition, the mean serum vitamin A and folic acid levels, not the vitamin B12 level, in children with autism were significantly lower than those in typically developing children (P < 0·01 and P < 0·05, respectively). All of the three detected vitamins were within the reference ranges in both groups.
Table 4. Comparison of the biochemical nutritional levels of autistic and normally developing children (n 53)
(Mean values and standard deviations)

* Two-sample/group t test.
Physical examinations for malnutrition
Physical examinations were conducted to assess the nutritional status of both groups. No significant differences were observed in the clinical symptoms between the groups. Among the fifty-three children with autism, one child had pale conjunctiva, six had scarce, dry and brittle hair, three had dry skin, one had cheilitis and three had rib eversion (Table 5). Among the typically developing children, four subjects had scarce, dry and brittle hair, two had dry skin, one had non-smooth nails and two had rib eversion. No other symptoms for malnutrition were found among the participants.
Table 5. Physical examination for malnutrition in children with autism and typically developing children (n 53)

* Fisher's exact test.
† Rib eversion: the bottom two ribs are prominent over the periphery of bony thorax.
Anthropometry
Table 6 summarises the average body height, body weight and general nutritional condition (Z score) of the fifty-three children with autism and fifty-three typically developing children. No statistical differences in height and weight were observed between the two groups. The mean BMI and the mean Z BMIA in children with autism were significantly higher than those in typically developing children (P < 0·05). No statistical differences in the mean Z WA and Z HA between the two groups were observed. However, the mean Z WH for children aged <60 months in the autism group was significantly higher than that in the typically developing children (P < 0·05).
Table 6. Anthropometric data and Z scores of children with autism and typically developing children (n 53)
(Minimum to maximum, mean values and standard deviations)

* Two-sample/group t test.
† The score was used for children aged below 60 months.
Discussion
This cross-sectional study compared the nutritional status of children with autism with that of typically developing children in China. An inadequate nutritional status was observed in children with and without autism. Children with autism exhibited more abnormalities in terms of eating behaviour and gastrointestinal symptoms, higher proportions of vitamin C and Ca intake inadequacies, as well as lower levels of serum Ca, vitamin A and folate. According to the anthropometry data, higher mean BMI, Z WH and Z BMIA were observed in children with autism than in typically developing children.
Eating problems are more frequent in children with autism than in typically developing children. This finding agrees with that in several previous reports, in which children with autism have higher incidence of food refusal and limited food repertoire than typically developing children( Reference Lockner, Crowe and Skipper 15 , Reference Schreck, Williams and Smith 18 ). Strict adherence to rituals and routines, which is a core feature of autism, has been suggested as a possible explanation for these eating problems( Reference Cascio, Foss-Feig and Heacock 12 ). Sensory integration dysfunction and sensory sensitivity that can cause eating discomfort also contribute to the food selectiveness of a child with autism( Reference Bandini, Anderson and Curtin 29 ). Such behaviours as food selectiveness and resisting trying new foods may indicate an attempt to compensate for this discomfort( Reference Zimmer, Hart and Manning-Courtney 30 ). Parents of children with autism often report a high rate of gastrointestinal symptoms( Reference Horvath, Papadimitriou and Rabsztyn 31 , Reference Quigley and Hurley 32 ) despite the lack of medical causes. Similar results were also found in the present study. Levy et al. ( Reference Levy, Souders and Ittenbach 33 ) reported that some gastrointestinal symptoms may be the result of opioid peptides that are formed from the incomplete breakdown of foods that contain gluten and casein. However, several studies have shown that a gluten-free, casein-free diet does not significantly alter the symptoms in children with autism( Reference Goday 34 ). Commercial gluten-free, casein-free products are not yet available in China and the dietary intakes of children with autism in our study were not restricted. Hence, the mechanism by which gastrointestinal problems occur in children with autism should be further investigated.
The limited number of published studies on nutrient intakes in children with autism have yielded conflicting results( Reference Xia, Zhou and Sun 13 , Reference Herndon, DiGuiseppi and Johnson 14 , Reference Cornish 35 ). Our results showed that the mean dietary intakes of vitamins A and B6, Ca and Zn in children with autism and typically developing children were <80 % of the DRI. This result indicated that the intakes of these nutrients were commonly inadequate among Chinese children. Based on the 2002 National Survey of Resident Nutritional Status in China, the rates of inadequacy intake and the borderline inadequacy intake were 9·1 and 41·8 % for vitamin A, respectively; the dietary Ca intake was 238 mg/d, which is only one-third of the adequate intakes in Chinese children below 6 years of age( Reference Yin and Lai 36 ). Several studies have also found that children with autism consume significantly lower amounts of Ca than those without autism( Reference Herndon, DiGuiseppi and Johnson 14 , Reference Cermak, Curtin and Bandini 37 – Reference Shearer, Larson and Neuschwander 39 ), a trend that was also observed in the present study. Based on the detected serum biochemical assessment, serum vitamin A and Ca levels in children with autism were significantly lower compared with those in children without autism (the serum Ca level of children with autism was also less than the reference range), which is consistent with the findings of the dietary assessment. A previous study reported that no significant difference is observed in the serum Ca levels between children with and without autism, and the detected values are within the normal reference range( Reference Adams, Audhya and McDonough-Means 40 ). However, the serum Ca level is increased when the Ca deposited in the skeleton is mobilised, thereby resolving Ca inadequacy. The proportion of Zn intake inadequacy in Chinese children is approximately 50 %( Reference Ma, Li and Jin 41 ). In the present study, although serum Zn levels were less than the reference range, no statistical difference was observed between the two groups. Therefore, Zn deficiency may be related with the characteristics of the Chinese diet, in which cereals constitute the main staple food. Moreover, the participants of our study live in the northernmost parts of China; fruit consumption in this region is much lower and vegetables are the primary source of vitamin C. The mean vitamin C intake level in children with autism was inadequate and significantly lower than that in typically developing children. This result is similar to a previous report that children with autism tend to refuse vegetables to a higher extent than typically developing children( Reference Lockner, Crowe and Skipper 15 ). No differences were observed in vitamin B12 levels between children with and without autism in our study. However, the serum folate levels in children with autism significantly decreased. A recent study has reported that serum homocysteine levels significantly increase and folate and vitamin B12 levels significantly decrease in children with autism compared with those in typically developing controls( Reference Ali, Waly and Al-Farsi 42 ). Some studies have also demonstrated that children with autism exhibit impaired methylation and homocysteine metabolism( Reference James, Cutler and Melnyk 43 , Reference James, Melnyk and Fuchs 44 ). Folate and vitamin B12 have an important function in homocysteine metabolism( Reference Adams, Audhya and McDonough-Means 40 ). Therefore, the folate defect observed in our study may lead to homocysteine accumulation in the body of children with autism.
The results of this study showed that the mean BMI, Z WH and Z BMIA of children with autism were significantly higher and the minimum to maximum extent of the above-mentioned parameters were wider compared with that in children without autism. This result indicated that a few children with autism were stunted, which suggests a possibility of becoming overweight and an increased risk of the more autistic children being obese. A previous work has indicated that children with autism also have the potential to be obese in addition to nutritional inadequacy( Reference Buie, Campbell and Fuchs 45 ). Thus, priorities for future research are identified to advance the understanding and management of overweight and obesity problems in children with autism.
Given the thorough examination of the nutritional status, this study may provide contributions to the relevant literature on the nutritional status of children with autism. The biochemical indexes, which have not been completely investigated in several studies, were considered and a stricter definition of autism that potentially decreased the heterogeneity of the children under observation was used. Several limitations, however, require adequate attention. For instance, we only considered the nutritional status of vitamin D for children based on their clinical symptoms. We did not evaluate the vitamin D intake and the serum 25-OH-D3 levels, which are the main limitations of this study. Another limitation of the food nutrient evaluation included the scope of the food diary, which was only observed based on a 3 d intake. These data may not adequately indicate the variety of a typical diet( Reference Falciglia, Horner and Liang 46 ). In addition, all the enrolled participants were from Heilongjiang Province, an area without a prosperous economy and with a 6 month-long winter. Thus, the results from this region may differ from those from other parts of China and from other countries.
In conclusion, nutritional inadequacies were observed in children with autism and typically developing children in China; these were, however, more pronounced among children with autism. Therefore, the nutritional status of children with autism should be regularly monitored to reduce these deficiencies by dietary means or by administering appropriate vitamin and mineral supplements.
Acknowledgements
W. X. was supported by the National Natural Science Foundation of China (no. 81072298). W. X. and L. W. were involved in designing the trial and writing the trial protocol, calculating the sample size, analysing the data and finalising the manuscript. W. X. was also involved in supervising subjects' recruitment, in data collection and in drafting the manuscript. C. S. and D. Z. were involved in diet surveys, data collection, analysing the data and revising the manuscript. Y. Z. and N. L. initiated and supervised the trial as principal investigators. All authors approved the final version of the manuscript. None of the authors had a personal or financial conflict of interest.


 Open access