


Hurricane Sandy struck the northeastern United States on October 29, 2012, causing extreme wind, rain, cold, and coastal surge conditions, impacting an estimated 60 million people across 24 states. Widespread flooding from the hurricane’s storm surge occurred along coastal areas of New York and New Jersey, causing extensive infrastructure damage and leading to power outages, inundation of subways and transit tunnels, evacuation of residential buildings, interrupted access to critical services, and closure of health care institutions. Disruptions lasted in some areas for months following the hurricane’s initial impact.Reference Gibbs and Holloway 1
In addition to the direct effects on morbidity and mortality from drowning, injury, and exposure during the hurricane,Reference Gibbs and Holloway 1 - 3 secondary effects on health and access to care, such as unmet post-disaster mental health care were also pronounced, particularly within the most vulnerable communities.Reference Tofighi, Grossman and Williams 4 - Reference Lowe, Sampson, Gruebner and Galea 7 The post-disaster impact from the hurricane on various measures of mental health and mental health care utilization were complex. Ongoing epidemiologic and health care evaluation and research following a disaster can make an important contribution to our understanding of the event, and to public health emergency preparedness and response in the future.Reference Lurie, Manolio and Patterson 8 Yet, to the best of our knowledge, little research has been conducted on how Hurricane Sandy disrupted and altered patterns of mental health care in New York City (NYC).
To determine whether temporal or spatial changes in the utilization of mental health–related services in NYC occurred during and after Hurricane Sandy, we analyzed emergency department (ED) visit and inpatient hospitalization data from the New York Statewide Planning and Research Cooperative System (SPARCS). In particular, we sought to assess how closures of three New York City hospitals, including Bellevue Hospital (BH) and New York University Langone Medical Center (NYULMC) in Manhattan, and Coney Island Hospital (CIH) in Brooklyn, impacted ED and inpatient utilization of mental health care. Our hypothesis was that Hurricane Sandy increased the need for mental health utilization in the short term and that, due to the hospital closures, patients shifted to nearby hospitals to address an increase in short-term need and to receive care for mental health needs unrelated to the hurricane. We used historical data for the 2-year period preceding Hurricane Sandy as a baseline and performed statistical tests to detect redistributions of mental health care utilization patterns over the 6 months following the hurricane.
Methods
Data Sources
In this study, New York State SPARCS data for 2010 to 2013 were used to obtain monthly counts of mental health–related inpatient hospitalizations and ED visits. International Classification of Diseases ninth revision (ICD-9) codes were used to identify mental health–related events from the SPARCS data (Appendix A). We selected all records with principle diagnosis ICD-9 codes of 295-297.99 (schizophrenia, bipolar, major depressive disorder and delusional/paranoid disorders), 298-298.99 (psychosis), 300-302.99 (neurosis, personality and sexual disorders), 306-309.99 (psychogenic, special symptoms, acute reaction to stress and adjustment disorders), 311-314.99 (depression, conduct, emotional and hyperkinetic disorders) and excluded 302.52 (trans-sexualism with homosexual history). ED visits that resulted in hospitalized admission records were included in both inpatient and ED analyses.
We focused our analysis on 5 geographic regions, including service areas of CIH, NYULMC, and BH, the Hurricane Sandy evacuation zone, and all of NYC. To determine the service areas, we first selected mental health inpatient and ED events from each hospital during the 6 months preceding Hurricane Sandy, and then created a list of the residential zip codes from patient records. For each hospital, the service area was defined as zip codes that generated 75% of total events during the 6 months prior to Hurricane Sandy. In addition, zip codes where 30% or more of the population were classified as being in evacuation zone 1 were considered to be in the Sandy evacuation zone 9 (Appendix B).
Statistical Analysis
To identify the spatial change in the immediate and long-term mental health impact of Hurricane Sandy, an aberration detection method by Farrington and colleaguesReference Farrington, Andrews, Beale and Catchpole 10 was used to identify increases in monthly mental health–related hospitalizations and ED visits after Hurricane Sandy for those living in the service areas of the 3 closed hospitals (CIH, NYULMC, BH) and in the Hurricane Sandy evacuation zone. Citywide detections were also generated for comparison purposes.
We first examined the trends of monthly mental health–related ED visits and inpatient admission counts from 2010 to 2013 in the 5 geographic regions. We then used the Farrington methodReference Farrington, Andrews, Beale and Catchpole 10 to detect whether monthly counts of mental health–related ED visits and inpatient hospitalizations had a statistically significant increase after Hurricane Sandy. The Farrington method has been widely used in outbreak detection. It uses historical data from the same period in previous years and applies the Bayesian approach to estimate the expected level of service use via a generalized linear Poisson model. In our analysis, we pre-defined January 2010 to September 2012 as the historical data period. Four months before and after the baseline time point in previous years was used to calculate expected monthly counts for our post-hurricane surveillance phase from October 2012 to July 2013. If the observed count was greater than the expected monthly count at the upper bound of the confidence interval, a signal was raised. To detect spatial redistribution of mental health services utilization attributed to the hospital closures, detection analyses were performed. Detection analyses assessed increases at each hospital due to utilization by patients from the 5 defined areas. These analyses were repeated for each of the 6 months after Hurricane Sandy to detect temporal redistributions. We evaluated the signals for hospitals among each of the 5 service areas for the 2-month period following Hurricane Sandy to assess immediate impact, and for the 6-month period following the hurricane to assess long-term impact.
All statistical analyses were performed using SAS 9.2 (Cary, NC) and Surveillance packageReference Höhle 11 in R 3.1.2 (Vienna, Austria). An aberration signal was raised when monthly counts were greater than the upper bound of the 99% statistical significance level of expected counts.
Results
ED Visits
From SPARCS ED data, we identified 130 228 mental health–related ED visits among NYC residents in NYC facilities in 2012, nearly 23% greater than the ED counts in 2010 (Figure 1). From the ED monthly count trend plot for NYC we observed that there was an overall decrease of mental health ED visits following Hurricane Sandy. According to results from the Farrington method, no immediate signal was raised in citywide analysis in November 2012. However, we found signals of increased ED use from March to May 2013. Further analysis of age-specific subgroups found that these signals were driven by patients younger than 18 years, but there was no association between a particular type of mental health–related diagnosis and the increase.

Figure 1 Statewide Planning and Research Cooperative System Mental Health–Related Emergency Department Diagnoses Among New York City residents in New York City Facilities From 2010 to 2013
Despite a small decrease in overall ED count citywide, several hospitals, including Lutheran, Maimonides, Metropolitan, St. Luke’s, Brookdale, and Woodhull, received increasing numbers of visits from people who lived in the closed hospitals’ service areas. Table 1 shows the number of ED aberration signals separately at the hospital level for the first 2 months after Hurricane Sandy, and among each of the 5 geographic areas. No aberrations were detected during the first 2 months in any hospital at the citywide level, or among patients living in the Sandy evacuation zone. Among patients living in the 3 closed hospitals’ service areas, increases for the first 2 months were detected in those hospitals that remained open. Two hospitals, Lutheran Medical Center and Maimonides Medical Center, picked up aberration signals among patients from the CIH service area. Additional immediate effects were identified in several hospitals, including Beth Israel Medical Center, Metropolitan Hospital Center, and Woodhull Medical, among patients from NYULMC and BH service areas. Table 2 shows that increased ED visits were detected at several hospitals at the citywide level during the 6-month period. Except for Mount Sinai, these hospitals also experienced an increased volume of mental health–related ED visits from individuals living in 3 service areas, indicating that redistributions of mental health–related ED visits due to the hospital closures may have shaped the 6-month citywide trend. Lastly, no ED visit aberrations were detected for people living in the Sandy evacuation zone (Tables 1 and 2).
Table 1 Hospitals With Immediate Aberration SignalsFootnote a in Mental Health–Related Emergency Department Visits by Geographic Region of the Patient and Select Hospitals (November 2012 to December 2012)
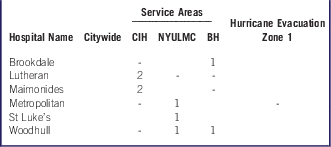
Abbreviations: CIH, Coney Island Hospital; NYULMC, New York University Langone Medical Center; BH, Bellevue Hospital.
a 1 = signal occurred in November or December 2012; 2 = signal occurred in both November and December 2012; - = no aberration test was performed because of the small number of patients.
Table 2 Hospitals With Long-Term Aberration SignalsFootnote a in Mental Health–Related Emergency Department Visits by Geographic Region of the Patient and Select Hospitals (November 2012 to April 2013)
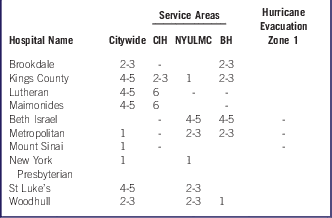
Abbreviations: CIH, Coney Island Hospital; NYULMC, New York University Langone Medical Center; BH, Bellevue Hospital.
a 1 = signal occurred at least 1 month after Hurricane Sandy; 2-3 = signal occurred at least 2-3 months after Hurricane Sandy; 4-5 = signal occurred at least 4-5 months after Hurricane Sandy; 6=signal occurred in all months after Hurricane Sandy; - = No aberration test was performed because of the small number of patients.
Inpatient Hospitalizations
There were 49 117 mental health–related hospitalization admissions among New York residents in New York City facilities in 2012 (Figure 2). By examining the plot of inpatient monthly counts, a considerable decrease was apparent in mental health hospitalizations during the first 3 months in NYC following Hurricane Sandy, and there was also no immediate signal or long-term signal raised in the aberration detection analysis.

Figure 2 Statewide Planning and Research Cooperative System Mental Health–Related Hospitalization Diagnosis Among New York City Residents in New York City Facilities From 2010 to 2013
Similar to ED visits, several hospitals, including Beth Israel, Interfaith, Lutheran, Kings County, and Maimonides, experienced an increasing number of psychiatric hospitalizations from people who lived in the closed hospitals’ service areas. Two hospitals, Interfaith Medical Center and Bronx-Lebanon Hospital Center–Fulton Division, had signals at the citywide level during the first 2 months (Table 3). Focusing on the CIH service area, we found signals at Kings County Hospital, Lutheran Medical Center, and Maimonides Medical Center. In the NYULMC and BH services areas, signals were found in the Beth Israel Medical Center/Petrie Campus and Interfaith Medical Center during the first 2 months after Sandy. Table 4 shows that the long-term trend of increased hospitalizations was similar to the short-term trend except for Richmond University Medical Center, which only experienced long-term increases. Similarly, at the service-area level, the long-term trend of increased volumes of mental health–related hospitalization was consistent with the short-term trend. Whereas signals were detected over 4-6 months in ED visits, increased volumes of psychiatric hospitalizations were found over 1 to 3 months. No hospitalization aberrations were detected for people living in the Sandy evacuation zone (Tables 3 and 4).
Table 3 Hospitals With Immediate Aberration SignalsFootnote a in Mental Health–Related Hospitalizations by Geographic Region of the Patient and Select Hospitals (November 2012 to December 2012)
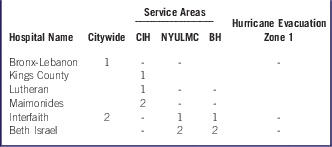
Abbreviations: CIH, Coney Island Hospital; NYULMC, New York University Langone Medical Center; BH, Bellevue Hospital.
a 1 = signal occurred in either November or December 2012; 2 = signal occurred in both November and December 2012; - = no aberration test was performed because of the small number of patients.
Table 4 Hospitals With Immediate Aberration SignalsFootnote a in Mental Health–Related Hospitalizations by Geographic Region of the Patient and Select Hospitals (November 2012 to April 2013)
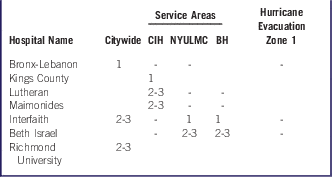
Abbreviations: CIH, Coney Island Hospital; NYULMC, New York University Langone Medical Center; BH, Bellevue Hospital.
a 1 = signal occurred at least 1 month after Hurricane Sandy; 2-3 = signal occurred at least 2-3 months after Hurricane Sandy; - = no aberration test was performed because of the small number of patients.
Discussion
This study found that the trends of mental health–related ED visits and hospitalizations among individuals living in the service areas of the closed hospitals were spatially and temporally altered during and after Hurricane Sandy. Even though there was no increase of count by diagnosis before and after Hurricane Sandy (Appendix C), several New York City hospitals that remained open received a substantially larger number of ED patients from these areas during the first 2 months after Hurricane Sandy than what was expected according to the historical trends. This significant surge was also observed in psychiatric hospitalizations among these cohorts. When we examined the 6-month period after Hurricane Sandy, the spatial shift of mental health service use, however, persisted only in ED visits.
Spatial and temporal changes in the mental health–related ED visits were consistent with the recent finding that total ED visits among individuals with histories of ED visits to 2 closed hospitals were shifted to the other hospitals.Reference Lee, Smith and Carr 12 In particular, our study found that a larger number of people who live in the mental health–related ED service areas of CIH visited Lutheran and Maimonides Medical Centers for the 6 consecutive months after the landfall of Hurricane Sandy. Similarly, there were significant increases in mental health–related ED visits to Beth Israel Medical Center among individuals from the service areas of NYULMC and BH. As expected, these hospitals were closely located to areas where they lived, confirming that the decision of which hospital to go to for an ED visit was likely driven by the proximity of hospitals.Reference Lee, Smith and Carr 12
Hurricane Sandy’s impact on psychiatric hospitalizations, as opposed to psychiatric ED visits, was less apparent. Excess numbers of psychiatric hospitalizations among individuals from the service areas of the closed hospitals were observed in 3 hospitals during the 2 months immediately after Hurricane Sandy, but these increased volumes did not persist for more than 3 months after Sandy. One explanation for the difference between mental health–related ED and hospitalization trends is that patients who were formerly hospitalized at the closed hospitals were more spatially dispersed than those with ED visits (Appendix B). Given the weak spatial association between hospitals and residence before Sandy, major spatial shifts of psychiatric hospitalizations after Hurricane Sandy might be unlikely. Another possible explanation is that similar to numbers in upstate New York, psychiatric hospitalization (48 806 hospitalizations in 2012) tends to occur less frequently in NYC hospitals compared with psychiatric ED visits (126 814 visits in 2012) (Appendix D). A 6-month time period may be too short to observe additional psychiatric hospitalizations after being discharged from hospitals. Lastly, hospital admission as opposed to ED visits is less likely to be made by a patient’s decision. Patients have less control over which hospitals they want to be admitted to, which explains the limited evidence on spatial association between patients’ residence and hospital locations when it comes to psychiatric hospitalization.
The study did not find evidence for spatial and temporal shifts of psychiatric ED visits and hospitalization trends among individuals living in the Hurricane Sandy evacuation zone. This could be because closed hospitals were not located in this area, so the pattern of access to psychiatric care might not have been impacted by the hospital closures. The other possibility is that substantial damage to housing and built infrastructures might have limited access to health care, resulting in the overall short-term decrease of mental health–related ED visits and hospitalizations, which has been reported elsewhere.Reference Lowe, Sampson, Gruebner and Galea 7
This study had several limitations. First, it did not examine individuals who were not living in the service areas. Although we assessed overall trends of mental health service use among NYC residents, which indicated the increasing trends in the hospitals that received patients from the service areas, we could not rule out the possibility that increased ED visits and hospitalization immediately after Hurricane Sandy might reflect citywide trends. Second, surges of patients from particular areas might not generate burdens on hospital capacity to provide services. Increased numbers might be handled using existing resources, or these hospitals might receive extra resources to handle increased demands. Third, we have tested statistical significance of aberration events in different hospitals and different time periods, which could inflate Type I error. To address this, we used a more conservative threshold to determine statistical significance (ie, upper bound of 99% confidence interval). Fourth, our study service areas might not capture the true facility service areas. With the lack of a formal definition of hospital service areas in NYC, we defined these areas using the zip codes with 75% of mental health patients who visited each of the 3 hospitals (CIH, NYULMC, and BH) for 6 months prior to Sandy. Although we captured the service areas based on distributions of patients, the validity of this definition has not been established. Last, citywide mental health–related ED and inpatient counts decreased during the post–Hurricane Sandy period. From the current data that we have, we were not able to examine the effect of other social factors on unmet health need. Despite these limitations, the study had some important strengths. First, the use of administrative data allowed us to capture almost complete ED and hospitalization events in NYC during and after Hurricane Sandy. Second, excess ED visits and hospitalizations were assessed using statistical tests. Last, we examined both spatial and temporal shifts of mental health service utilization patterns during and after Hurricane Sandy, providing a more realistic assessment of burdens on the health care system.
The current findings have important policy implications. First, proximity to closed hospitals during disasters should be considered when resources are allocated to hospitals to accommodate potential surges of psychiatric ED visits. Second, as temporal shifts of the ED visit trend indicate, support for increased psychiatric ED visits may need to be continued for a longer time period. Third, assessing causes of ED visits in hospitals receiving surges is needed to determine whether increased volumes reflect spatial shifts or shifts from hospitalizations resulting from limited capacity of inpatient cares.
In conclusion, the hospital closures due to Hurricane Sandy significantly impacted trends of mental health–related ED visits among individuals living in the service areas of the closed hospitals. The study described and tested changes in patient volume in selected hospitals during the 6 months after landfall, quantifying hospital burdens that were found in the previous qualitative study.14 Due to the spatial changes on post-disaster mental health utilization, resource allocation to these impacted hospitals should be incorporated into disaster preparedness efforts. Future studies are warranted to assess whether hospitals receiving patients from the closed hospitals received additional resources in a timely manner. It will improve our understanding about true burdens of emergency events on the NYC hospital system in serving mental health patients.
Acknowledgments
This work was supported by the Cooperative Agreement Number 1U01TP000585-01 from the Centers for Disease Control and Prevention. Its contents are solely the responsibility of the authors and do not necessarily represent the official views of the Centers for Disease Control and Prevention.
Supplementary Material
To view supplementary material for this article, please visit http://dx.doi.org/10.1017/dmp.2016.89


