


Chronic kidney disease (CKD) is a public health problem associated with poor outcomes(Reference Keith, Nichols and Gullion1,Reference Wen, Cheng and Tsai2) . CVD is the leading cause of death in patients with end-stage renal disease (ESRD)(Reference Go, Chertow and Fan3). Observational studies in dialysis patients have indicated that traditional cardiovascular risk factors cannot fully explain the high mortality rate(Reference Eknoyan, Beck and Cheung4). Malnutrition is one of the non-traditional cardiovascular risk markers in dialysis patients(Reference Kalantar-Zadeh, Kopple and Block5). Most patients with advanced CKD will have some type of nutrition abnormality(Reference Saran, Li and Robinson6). However, many patients are not routinely followed by a dietitian or nutrition professional(Reference Lopes, Bragg-Gresham and Elder7) and many hospitals still do not incorporate measures to evaluate and monitor the nutritional state of patients. Therefore, well validated and easy to use tools to identify patients at malnutrition risk are critically needed by the renal community. Unfortunately, there are few well validated screening tools to identify CKD patients who are potentially at malnutrition risk and adequate nutrition is a strategy that is sometimes forgotten in the management of CKD patients(Reference Hecking, Bragg-Gresham and Rayner8).
In 2008, the International Society of Renal Nutrition and Metabolism (ISRNM) developed the new concept of protein–energy wasting (PEW), as a single pathological condition in which undernourishment and hypercatabolism converge(Reference Fouque, Kalantar-Zadeh and Kopple9). Assessment of malnutrition should be based on the combination of clinical, anthropometric and body composition parameters using bioelectrical impedance (BIA vector or multifrequency) and biochemical parameters including hormonal and inflammatory biomarkers(Reference Cano, Aparicio and Brunori10). The diagnosis of malnutrition as defined by PEW requires the joint evaluation of several of these methods (Table 1). Malnutrition is a dynamic process that requires an initial assessment of nutritional status and subsequent monitoring(Reference Fouque, Vennegoor and ter Wee11). PEW criteria are initially attractive due to their multifactorial scope (analytical, anthropometric and nutritional), but implementation in clinical practice may be confusing. Recently, Moreau-Gaudry et al. (Reference Moreau-Gaudry, Jean and Genet12) from the group of Denis Fouque proposed a new simplified classification by adding a new criterion, serum creatinine adjusted for body surface area (sCr/BSA) to replace a reduction in muscle mass over time (5 % in 3 months or 10 % in 6 months) in the muscle wasting category(Reference Moreau-Gaudry, Jean and Genet12). The advantage of this new marker to the clinician is that it is easy to measure and allows an earlier diagnosis of protein wasting, not requiring waiting for 3–6 months to observe the loss of muscle mass before a diagnosis is made and therapeutic measures are implemented.
Table 1 Protein–energy wasting (PEW) prevalence according to International Society of Renal Metabolism and Nutrition (ISRMN) 2008 or PEW-score 2014 (serum creatinine adjusted for body surface area (sCr/BSA)) criteria in haemodialysis patients (Numbers and percentages)

MUAMC, mid-upper arm muscle circumference; nPCR, normalised protein catabolic rate.
* PEW prevalence introducing the new variable sCr/BSA.
† Criteria from PEW-score 2014 include serum albumin ≤3·8 g/dl (≤38 g/l), BMI ≤23 kg/m2, SCr/BSA ≤3·8 mg/dl per m2 (≤336 µmol/l per m2) and nPCR ≤0·8 g/kg per d.
‡ Weight loss >5 % in 3 months or >10 % in 6 months.
§ Muscle mass loss >5 % in 3 months or >10 % in 6 months.
|| Low MUAMC: reduction of 10 % in relation to 50th percentile of reference population.
We have now analysed the prevalence of PEW according to the 2008 ISRNM classification and the new PEW-score 2014 incorporating sCr/BSA and the relationship of these PEW definitions with mortality risk.
Methods
Patients
This is a post hoc analysis of a cross-sectional study with prospective follow-up of prevalent dialysis patients conducted at the Iñigo Alvarez de Toledo Kidney Foundation (FRIAT) haemodialysis centre of the Fundación Jiménez Díaz Hospital, Madrid, Spain. All prevalent patients (n 122) on maintenance haemodialysis at the dialysis centre were screened. Study subjects were recruited from 1 January to 1 February, 2011. The cohort has been described in more detail elsewhere( Reference Gracia-Iguacel, González-Parra and Pérez-Gómez13 ). Of the 122 patients, in 109 patients the PEW – score 2014 could be calculated, one of these patients was withdrawn since bioimpedance muscle mass data were not available in the category according to the criteria of the PEW–ISRNM 2008 classification. The study was approved by the Ethics Committee and signed informed consent was obtained from all enrolled patients.
Comorbidities were recorded for each patient and scored according to Davies criteria( Reference Fried, Bernardini and Piraino14 ). Dialysis therapy was performed for at least 4 h thrice weekly, using ultrapure water. The dialysate Ca concentration was 1·75 or 1·5 mmol/l. Adequacy of dialysis was estimated by mid-week single-pool Kt/V urea from pre- and post-dialysis blood urea nitrogen (BUN) levels and pre- and post-dialysis body weight(Reference Daugirdas15). Overall survival was determined from the day of inclusion to 1 October 2013, with a median follow-up of 20 (interquartile range 8–31) months. Since in PEW–ISRNM 2008, patients may fulfill bioimpedance muscle wasting criterion every 6 months, when bioimpedance is assessed, short-term survival was evaluated at 9 months, a time-point halfway between the first (6 months) and second (12 months) repeated assessments of bioimpedance muscle wasting. No patient was lost to follow-up during this period.
Body composition and nutritional status
A single observer performed anthropometric and body composition measurements immediately after the mid-week dialysis session on the same day that blood samples were collected. PEW criteria were calculated according to the panel of experts of the ISRNM (Table 1)( Reference Fouque, Kalantar-Zadeh and Kopple9 ). The classification of PEW according to the PEW–ISRNM 2008 was based on several criteria listed in Table 1, PEW was assigned to patients meeting at least three criteria in the four different categories for malnutrition markers at baseline( Reference Fouque, Kalantar-Zadeh and Kopple9 ). In addition, the PEW-score 2014 was determined based on presence of one or more than the following: serum albumin ≤3·8 g/dl (≤38 g/l), BMI ≤23 kg/m2, SCr/BSA ≤3·8 mg/dl per m2 (≤336 µmol/l per m2) and nPCR ≤0·8 g/kg per d (see Table 1) following Moreau-Gaudry et al. ( Reference Moreau-Gaudry, Jean and Genet12 ) from the group of Denis Fouque. A patient with a value strictly greater than the threshold would receive a score of 1; if below the threshold, the score would be 0; the individual score was comprised between 4 (normal nutrition status) and 0 (severe wasting). Patients not meeting any criteria were scored as 4, which means a normal nutrition status. Meeting 1 criterion (score 3) means mild malnutrition. Meeting 2 criteria (score 2) means moderate malnutrition and meeting ≥3 criteria (score of 1 or 0) means severe malnutrition status. To compare the two PEW classifications, we regrouped the PEW-score 2014 categories of moderate and severe malnutrition (scores 0, 1 or 2) as presence of PEW and the categories of mild malnutrition and normal nutrition (scores 3 or 4) as no PEW (Table 1).
The BMI was expressed in kg/m2. Weight was calculated as dry weight, defined as post-dialysis weight in which the patient was normotensive and with no signs of overhydration (OH). BSA was estimated in cm2 by the equation: BSA=0·0003207 × (weight)0·7285–0·0188×log(weight) × (height)0·3. The triceps fold (TF) was measured in millimeters with a plicometer in triplicate (lipocalibre Holtain) in the arm contralateral to the vascular access. The brachial circumference (BC) was measured in centimeters in the middle third with a flexible tape measure (Holtain Ltd). TF and BC were used to calculate the mid-upper arm muscle circumference (MUAMC) using the formula MUAMC=BC–(0·314×TF)( Reference Kopple16 ). Body composition analysis was performed postdialysis, after a 15 min rest period, every 6 months by bioimpedance spectroscopy using the Fresenius Medical Care BCM body composition monitor. Electrodes were placed in the contralateral side to the vascular access location. The two compartments: lean tissue mass, adipose tissue and OH (overhydration; the excess of ECW from TBW) were identified from weight, height, intracellular water (ICW) and extracellular water (ECW) measurements( Reference Machek, Jirka and Moissl17 ). Muscle wasting was defined from LTM as a reduction in muscle mass of ≥5 % over 3 months or ≥10 % over 6 months( Reference Fouque, Kalantar-Zadeh and Kopple9 ). To avoid inter-observer variation, a single well-trained nephrologist (C. G.-I.) performed all bioimpedance assessments. Then nPCR, expressed as g/kg per d, was estimated from the Kt/V urea, an index of urea removal during dialysis, and the average BUN (midweek) as follows( Reference Jindal and Goldstein18 ):
 {\rm{nPCR}}=(0\cdot0136\times[{\rm{Kr}}/{\rm{V}}_{\rm{urea}}\times\left([{\rm predialysis\ BUN{\plus}postdialysis\ BUN}]{\div}2)] \right){\plus}0\cdot251.
Biochemical analysis and other samples
Blood samples were collected at the start of the mid-week dialysis session, the same day as anthropometric data were obtained. In all, 20 min after drawing blood, samples were centrifuged at 4°C and those not immediately analysed were stored at −80°C until analysis. Albumin (bromocresol technique, reference range 38–44 g/l), creatinine, C-reactive protein and cholesterol were measured by an automatic analyser. Prealbumin was measured by Nephelometry (Qm 300 nephelometer; Kalestad Diagnostic, reference range 100–400 mg/l), transferrin by immunoturbidimetry (ADVIA 2400 automatic analyser), 25-hydroxyvitamin-D by immunoassay (DiaDorin LIASON®) and intact parathyroid hormone by electrochemiluminescence (Elecsys-2010; Roche Diagnostics) in the Biochemistry Laboratory at Hospital Fundacion Jimenez Diaz.
Statistical analyses
Statistical analyses were performed using R (version 3.0.1). Quantitative variables with normal distribution were described by mean and standard deviation, and those with non-normal distribution were described by median and interquartile range. Qualitative variables were described by absolute and relative frequencies. The normality of the distribution of variables was evaluated by the Kolmogorov–Smirnov test. Comparisons of quantitative variables with normal distribution were performed by Student’s t test, when comparing two groups and one-way ANOVA when comparing more than two groups. For quantitative variables with non-normal distribution, comparisons were performed by Wilcoxon rank sum test when comparing two groups, and by Kruskal–Wallis test when comparing more than two groups. Qualitative variables were compared using χ 2 test if none of the four expected values was <5 (2×2 tables) or if none of the expected values was <1, and no more than 20 % of expected values was <5 (larger than 2×2 tables); or Fisher’s exact when the approximation to χ 2 distribution was not appropriate. Pearson correlation coefficient was used to evaluate associations between malnutrition markers and the selected parameters after confirmation of a normal distribution. The prevalence of PEW according to PEW–ISRMN 2008 and PEW-score 2014 classifications was compared using the McNemar’s test and the κ concordance coefficient. Univariate Cox proportional hazard regression models were used to assess the relation between mortality and muscle mass criteria. The models were summarised using the hazard ratios with 95 % CI, and the P values. For the analysis of mortality, survival curves were estimated using the Kaplan–Meier method and compared by the log-rank test. Univariable Cox regression models for mortality were estimated, and a multivariable Cox regression model was constructed, taking as potential predictors those variables with a P-value <0·2 in the univariable models. All comparisons were performed with two-sided tests and a level of significance of 0·05. Cox regression has been conducted for the observation periods up to 12 and up to 24 months with the exact time points of deaths known.
The level of significance and the power were fixed at 5 and 80 %, respectively. A hazard ratio of 0·6 was taken as effect size, and the standard deviation of the covariate was fixed at 0·5. With these parameters a sample size of 121 patients was calculated using the function ‘power’ of the statistical software Stata 14( Reference Hsieh and Lavori19 ).
Results
Patient characteristics
Haemodialysis patients were clinically stable; their mean age was 64 (sd 13) years, forty-nine (45 %) were women and dialysis vintage was 59 (sd 79) months. The causes of ESRD were chronic glomerulonephritis (n 22; 20 %), interstitial nephritis (n 12; 11 %), polycystic kidney disease (n 12; 11 %), vascular (n 31; 28·4 %), diabetic nephropathy (n 16; 15 %), unknown (n 13; 12 %) and other causes (n 3; 2·8 %). A total of twenty-three patients (21 %) were diabetic and forty-four (40 %) presented a clinical history of CVD. Vascular access was arteriovenous fistula (n 100; 92 %) or permanent catheter (n 9; 8 %). Mean Kt/V urea was 1·42 (sd 0·18). Membranes were high-flux polysulfone (27 %), low-flux polysulfone (41 %) and high-flux polynephron (32 %).
Prevalence of malnutrition according to protein–energy wasting–International Society of Renal Nutrition and Metabolism 2008 and to protein–energy wasting-score 2014
The PEW prevalence differed depending on the classification used. PEW prevalence was 41 % (forty-four of 108 patients) for PEW–ISRNM 2008, and 63 % (69 of 109 patients) for PEW-score 2014 (P≤0·002, McNemar’s test) (Table 1). Furthermore, the κ concordance coefficient was 0·33 (95 % CI 0·17, 0·49), indicating a low concordance. According to PEW-score 2014, twenty-nine (27 %) patients presented severe malnutrition (score 0–1, that is, they met 3–4 malnutrition criteria), forty (37 %) presented moderate malnutrition (score 2, met two malnutrition criteria), thirty-three (30 %) patients presented mild wasting and only seven patients (6 %) presented a normal nutritional status. The distribution of the different malnutrition markers according to PEW–ISRNM 2008 and PEW-score 2014 is presented in Table 1.
Of the total population, 49 % had an albumin level <38 g/l, 35 % had prealbumin levels <300 mg/l and only 2·7 % had cholesterol levels <2·59 mmol/l. Among the body composition and anthropometric parameters, 41·6 % had a BMI <23 kg/m2, 42 % had a MUAMC below the 50th percentile for the population, 21 % had sCr/BSA <336 µmol/l per m2 and 73 % had an insufficient protein intake, defined as nPCR <0·8 g/kg per d.
The clinical characteristics and phenotypes of patients according to PEW-score 2014 were analysed (Table 2). Patients with severe PEW were significantly more frequently female, and had lower dialysis vintage and albumin as well as higher levels of bicarbonate. Although PEW patients presented a significant lower interdialytic weight gain, they had a significantly higher fluid overload with a significantly lower ICW; but there were no significant differences with regards to age, CVD or DM and other biochemical parameters.
Table 2 Clinical characteristics of 109 prevalent haemodialysis patients according to degree of malnutrition (protein–energy wasting (PEW)-score 2014 serum creatinine/body surface area)Footnote *Footnote † (Mean values and standard deviations; numbers and percentages; medians and interquartile ranges (IQR))
SBP, systolic blood pressure; ECW, extracellular water; ICW, intracellular water; Pro-BNP, pro-brain natriuretic peptide.
* Quantitative variables described by means and standard deviations (normal distribution) or by medians and interquartile ranges (non-normal distribution).
† Qualitative variables are compared by the χ 2 test or Fisher’s exact test. Quantitative variables were compared by Student’s t test (normal distribution) or by the Wilcoxon rank sum test (non-normal distribution).
We had previously described the clinical characteristics of patients diagnosed of PEW according to PEW–ISRNM 2008 (Reference Gracia-Iguacel, González-Parra and Pérez-Gómez13) (online Supplementary Table S1). Patients with PEW according to this definition had significantly higher systolic blood pressure at the end of the dialysis and lower total body water, ECW, Hb, TAG and interdialysis weight gain. No differences in sex, dialysis vintage, age, CVD or DM were found (Reference Gracia-Iguacel, González-Parra and Pérez-Gómez13). Thus, the clinical characteristics of patients with PEW as identified by PEW–ISRNM 2008 υ. those without PEW differ from the clinical characteristics of patients with PEW as identified by PEW-score 2014 υ. those without PEW.
Serum creatinine/body surface area and markers of muscle mass
We next evaluated the correlation between sCr/BSA and measures of muscle mass. sCr/BSA correlated with baseline LTM (ρ=0·41, P<0·001) and negative with baseline MUAMC (ρ=–0·21, P=0·033).
Predictors of mortality
During follow-up, twenty-two patients died, seventeen received a kidney transplant and five changed centres. Of the twenty-two deaths, eight (36 %) were due to cardiovascular causes, two (9 %) to cancer, six (27 %) to infectious causes, five (23 %) to deterioration in their general status and one (5 %) to other causes. Patients who died had significantly lower sCr levels (628 (sd 150) υ. 751 (sd 159) µmol/l; P=0·012) and a trend towards lower sCr/BSA (243 (sd 189) υ. 327 (sd 194) µmol/l per m2; P=0·066) but MUAMC (26·5 (sd 3·3) υ. 26·2 (sd 3·7); P=0·7) values were similar to patients who survived.
We first analysed short-term (9 months) mortality, given that the prognostic impact of any baseline variable was expected to more likely impact short-term than long-term mortality. Within the first 9 months of follow-up, 5/44 (11 %) patients with PEW and 2/64 (3 %) patients without PEW according to PEW–ISRNM 2008 died (Table 3). By contrast 7/69 (10 %) patients with PEW according to PEW-score 2014 died, while no deaths were observed among patients without PEW (Table 3). The Kaplan–Meier curve showed no differences in the risk of death between patients with and without PEW according to PEW–ISRNM 2008 criteria (Fig. 1(a)). However, a diagnosis of PEW according to PEW-score 2014 was significantly associated with mortality (Fig. 1(b)). Analysis of subgroups within patient with PEW according to PEW-score 2014 yielded similar results (online Supplementary Fig. S1).
Table 3 Mortality according to protein–energy wasting (PEW) score (Numbers and percentages)

ISRNM, International Society of Renal Nutrition and Metabolism; sCr/BSA, serum creatinine/body surface area.
* PEW prevalence introducing the new variable sCr/BSA.
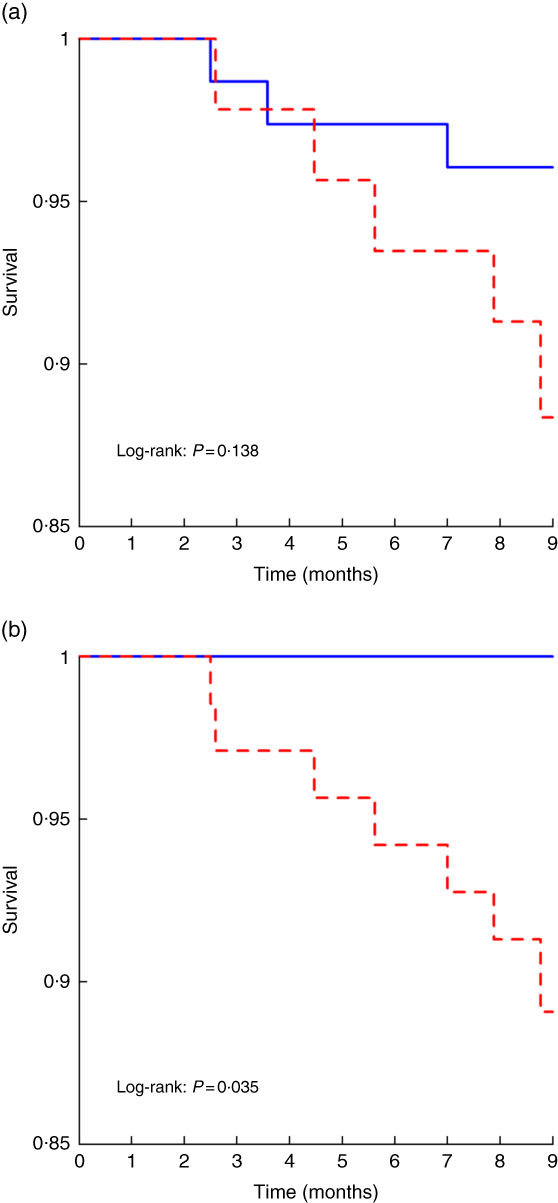
Fig. 1 Kaplan–Meier curves for the time to short-term mortality according to protein–energy wasting (PEW)–International Society of Renal Nutrition and Metabolism (ISRMN) 2008 (a) and PEW-score 2014 (b). For PEW-score 2014, patients were considered to have PEW when the score was 0–2 and not to have PEW when the score was 3–4.
![]() , No PEW;
, No PEW;
![]() , PEW.
, PEW.
The sensitivity of a PEW diagnosis according to PEW-score 2014 criteria for early mortality was 100 %, while the positive predictive value was 10 %. In addition, it had a specificity of 39 % and a negative predictive value of 100 %.
During the full follow-up, 10 of 44 (23 %) patients with PEW and 12/64 (19 %) patients without PEW according to PEW–ISRNM 2008 criteria died (Table 3). The corresponding mortality figures for PEW-score 2014 were 12 of 69 (17 %) patients who had PEW and 10/40 (25 %) without PEW (Table 3). Thus, when analysing long-term (full follow-up) mortality, no significant difference in mortality was observed between PEW and non-PEW patients when PEW was defined either with the PEW-ISRNM 2008 or the PEW-score 2014. However, on univariate analysis, some biomarkers of muscle mass, sCr/BSA, sCr and LTM loss (but not MUAMC) were associated with all-cause mortality, sCr/BSA (online Supplementary Table S2).
Cox regression analysis of predictors of early death confirmed a non-significant trend (P=0·069) to predict mortality by a PEW diagnosis according to PEW-score 2014, which was not significant at long-term follow-up (online Supplementary Tables S3 and S4).
Discussion
The main finding of the study was that the new classification PEW-score 2014 allowed a simple detection of malnourished patients that identified a higher percentage of PEW patients than the PEW–ISRNM 2008 classification. PEW, as identified by PEW-score 2014, appeared to be clinically significant, since it was associated with short-term mortality in univariate analysis and with a non-significant trend in multivariate analysis, while absence of PEW was associated with short-term survival. The simple marker sCr/BSA was well correlated with markers of muscle mass such as LTM assessed by bioimpedance.
The new PEW-score 2014 includes categories of malnutrition from mild or moderate to severe (meeting at least four, three or two criteria of malnutrition) while PEW–ISRNM 2008 only identifies patients with severe malnutrition (meeting at least three criteria). In this regard, the presence of malnutrition was higher with the new PEW-score 2014 (63 %) than with PEW–ISRNM 2008 (41 %). These results are in line with results of a meta-analysis of PEW prevalence in centres using subjective global assessment (SGA) or malnutrition inflammation score (MIS) to assess PEW in patients with kidney disease( Reference Carrero, Thomas and Nagy20 ). In ninety studies from thirty-four countries including 16 434 patients on maintenance dialysis, the 25th–75th percentiles range of prevalence of PEW among dialysis studies varied between 28 and 54 %.
As expected from the more comprehensive identification of PEW patients, PEW-score 2014 identified more patients at risk than PEW–ISRNM 2008, thus enhancing the chances of early nutritional intervention. However, contrary to the general rule that increased sensitivity is frequently associated with decreased specificity, patients classified by PEW–score 2014 as having PEW were at high risk of death, while patients identified as not-PEW by PEW-score 2014 had a 100 % short term survival. By contrast, deaths were recorded among patients identified as not-PEW by PEW–ISRNM 2008. The association between both PEW scores and mortality was lost on longer follow-up. The association with short-term but not long-term mortality is not surprising given that PEW-score 2014 provides, as used in the present analysis, a static assessment at a single point in time and not a dynamic assessment. The association of mortality supports the clinical significance of PEW as diagnosed with this new score. The ability of repeated PEW assessment by PEW-score 2014 to predict short-term mortality over time on a dynamic basis should be tested in specifically designed studies.
sCr/BSA is the new criterion introduced by PEW-score 2014. sCr is a well–known, easy to measure biomarker of muscle mass. Indeed, an equation allows calculating LTM based on sCr in haemodialysis patients without residual diuresis(Reference Noori, Kovesdy and Bross21). Low sCr levels are associated with higher mortality, although the cut-off point that signals the higher mortality risk has varied widely between studies: <663 µmol/l in the Dialysis Outcomes and Practice Patterns Study (DOPPS) of 40 950 haemodialysis patients(Reference Lopes, Bragg-Gresham and Elder22), <601 µmol/l in the 4D (Die Dutch Diabetes Dialysis) study of 12 550 diabetic haemodialysis patients(Reference Drechsler, Grootendorst and Pilz23) and <884 µmol/l in the CONvective TRAnsport STudy (CONTRAST) of 560 haemodialysis patients(Reference Mazairac, de Wit and Grooteman24). In our study, sCr was associated with other biomarkers of muscle mass as LTM and MUAMC. When adjusted by BSA, sCr was still correlated with LTM, but not with MUAMC. In the general population, MUAMC assesses muscle mass. However, in other studies in haemodialysis patients, the agreement between MUAMC and muscle mass was poor(Reference Stosovic, Stanojevic and Simic-Ogrizovic25).
Certain limitations need to be considered in the interpretation of the present findings, starting by its observational nature that precludes the assessment of causality. Whereas neither PEW–ISRNM 2008 nor PEW-score 2014 were independently associated with mortality, this may be related to the small sample size and the small number of events in the current study. In most previous studies, PEW associates with increased mortality and this was the case also for PEW defined according to PEW-score 2014 as reported by Moreau-Gaudry et al. (Reference Moreau-Gaudry, Jean and Genet12) PEW defined by other common tools such as SGA(Reference Dai, Mukai and Lindholm26), or the MIS, have also been shown to be independently associated with increased mortality in dialysis patients.
In conclusion, as compared to the classification of PEW in dialysis patients using the PEW–ISRNM 2008 criteria, the new PEW-score 2014 appear to be more clinically relevant as it allows an earlier diagnosis of PEW, not requiring waiting for 3–6 months to observe loss of muscle mass before a diagnosis is made. PEW-score 2014 identified a higher proportion of PEW patients than PEW–ISRNM 2008, suggesting that therapeutic and preventive measures may be warranted in a larger number of patients than when using the PEW–ISRNM 2008 criteria. While PEW defined by the two scores was not independently associated with mortality, this may be due to the limited number of patients. Future studies in larger patient cohorts should investigate to what extent the prevalence of PEW, and associations of PEW with short-term and long-term mortality, differ between different PEW criteria including those used in the present study, SGA and MIS.
Acknowledgements
A. O. is supported by FIS PI16 02057. All authors are supported by FEDER funds ISCIII-RETIC REDinREN RD12/0021. E. G.-P. is supported by FIS PI16/01298. This research received no specific grant from any funding agency, commercial or not-for-profit sectors.
All authors have contributed in this article: C. G.-I. and E. G.-P. were responsible for dialysis patients, have contributed in the data collection, analysis of the results and writing the manuscript. I. M. has performed the statistical analysis. A. O. has contributed in the writing and correction of the manuscript.
None of the other authors has any other conflict of interest.
Supplementary material
For supplementary material/s referred to in this article, please visit https://doi.org/10.1017/S0007114519000400


