
Abstract
Commonly used discrete choice model analyses (e.g., probit, logit and multinomial logit models) draw on the estimation of importance weights that apply to different attribute levels. But directly estimating the importance weights of the attribute as a whole, rather than of distinct attribute levels, is challenging. This article substantiates the usefulness of partial least squares structural equation modeling (PLS-SEM) for the analysis of stated preference data generated through choice experiments in discrete choice modeling. This ability of PLS-SEM to directly estimate the importance weights for attributes as a whole, rather than for the attribute’s levels, and to compute determinant respondent-specific latent variable scores applicable to attributes, can more effectively model and distinguish between rational (i.e., optimizing) decisions and pragmatic (i.e., heuristic) ones, when parameter estimations for attributes as a whole are crucial to understanding choice decisions.
1 Introduction
Understanding why individuals make certain decisions that entail a discrete choice—such as purchasing from a particular retailer, while not purchasing from an alternative retailer; buying one brand rather than another; or accepting one employment offer but not another—is crucially important in business (Hensher et al. 2015; Louviere et al. 2008). Irrespective of whether an individual engages in rational, optimizing decision-making or in pragmatic, heuristic decision-making, the ensuing intention concerning, or choice that pertains to, a particular alternative is based on an assessment of the attributes of each alternative and the individuals’ preferences for such attributes. A variety of analytical approaches have been applied; aimed at trying to specify the relative impact of these attributes empirically so that to understand and predict choices based on these attributes. For example, discrete choice modeling (DCM; Louviere et al. 2000) has been applied to understand the impact of revenue management and loyalty program attributes on travelers’ purchasing choices (Mathies et al. 2013), of value creation and value appropriation attributes on managers’ outsourcing choices (Lin et al. 2016) and of location attributes on foreign direct investment choices (Buckley et al. 2007). Then, as one of the alternative approaches, partial least squares structural equation modeling (PLS-SEM; Lohmöller 1989; Sarstedt et al. 2017a; Wold 1982) has been employed to explain and predict the impact of attributes such as expected return and asset familiarity on choice of investment portfolio (Seetharaman et al. 2017), ease of use and trustworthiness on intentions to use consumer-generated media for travel planning (Ayeh et al. 2013) and price and convenience on, ultimately, intentions to purchase travel online (Amaro and Duarte 2015). Notwithstanding other analytical approaches, DCM, however, remains the commonly referred to analytical approach to explain discrete choices.
Early work involving DCM rested on the assumption that decision-making is a rational and optimizing (i.e., utility maximizing) process (McFadden 1974), but more recently DCM has been applied to assess pragmatic, heuristic decision-making (Bateman et al. 2017). The approach draws on different types of data such as revealed preference data to explain choices pertaining to actual alternatives, stated preference data to explain choices related to hypothetical alternatives, or both (Louviere et al. 2000, Chapter 1). But analyzing any data to empirically determine the importance weights that individuals place on different attributes, which in turn shape their preference for a particular alternative, remains challenging (Kamargianni et al. 2014). More specifically, the estimated parameters in traditional DCM analyses are the marginal utility associated with a change in the attribute level in moving from one alternative to another (e.g., changes in payment terms from 30 to 60 days). But directly estimating the importance weights of the attribute as a whole (e.g., payment terms relative to opening hours), rather than of distinct attribute levels, is less straightforward and requires additional calculations, since commonly used DCM analyses draw on the estimation of importance weights that apply to different attribute levels (for example, see Louviere et al. 2000, Chapters 11 and 12). Traditional DCM estimations apply commonly used multivariate analysis methods (e.g., probit, logit and multinomial logit models) when analyzing stated preference data generated through discrete choice experiments (DCE), but focus on the attribute level rather than the attribute itself (Louviere et al. 2000, Chapter 1). Indeed, “despite common practice, relative attribute impacts in DCEs cannot be inferred directly from parameter estimates” (Lancsar et al. 2007, p. 1752).
While Lancsar et al. (2007) suggest that partial log-likelihood analysis, consideration of the marginal rate of substitution for non-linear models, incorporation of Hicksian welfare measures, probability analysis, and best–worst attribute scaling can assist in overcoming the limitations of traditional DCM approaches, the objective of this article is to explore an alternative, until now overlooked, approach and, specifically, to substantiate the usefulness of PLS-SEM for the analysis of stated preference data generated through DCE in DCM to directly estimate the importance weight of the attribute as a whole. PLS-SEM is capable of estimating path models with latent variables, and can combine the information for each level of an attribute, which then represents the attribute as a whole in the path model (i.e., with the attribute levels as indicators of the parent latent variable). Similar to linear multiple regressions models, the PLS-SEM algorithm requires metric data or quasi-metric data for the indicators used in the constructs’ measurement model (Hair et al. 2017b, Chapter 1). However, the method also works well with binary coded data. The use of binary coded data is often a means of including categorical control variables or moderators in PLS-SEM models. Recent work has also started exploring the use of non-metric (i.e., ordinal and categorical) data as indicators in the measurement models of latent variables for the estimation of PLS path models (Bodoff and Ho 2016; Cantaluppi and Boari 2016; Jakobowicz and Derquenne 2007; Russolillo 2012; Schuberth et al. 2018). These works, however, do not sufficiently account for the early works of Bertholet and Wold (1984) and Lohmöller (1989, Chapter 4). About three decades ago, these authors proposed comprehensive solutions for using the basic PLS-SEM algorithm in a way that it is applicable to categorical variables using binary coding. Bertholet and Wold (1984) and Lohmöller (1989, Chapter 4) also point out how the use of PLS-SEM with binary data rests on meeting selected data requirements, which, as we show, DCE data thoroughly meets.
When a binary dependent single-item construct is specified in a PLS path model, the algorithm solution is equivalent to a binary linear regression (Lohmöller 1989, Chapter 4), and using DCE data yields estimates of linear probability models (LPMs). Results of this type of PLS-SEM application, therefore, produce estimates of importance weights for each attribute as a whole (i.e., in the structural model) as well as for the specific attribute levels (i.e., in the measurement model of the latent variables). While PLS-SEM has the ability to produce binary choice model estimates, neither the academic nor practitioner communities have taken advantage of this feature of PLS-SEM (for notable exceptions, see Bertholet and Wold 1984; Lohmöller 1989; Streukens et al. 2010). Therefore, applying PLS-SEM, as suggested in this research, expands the analytical scope for analyzing DCE data. Moreover, this type of PLS-SEM application facilitates empirical determination of the importance weights of attributes as a whole for individuals, and provides a foundation to empirically assess and advance our understanding of the decision making that characterizes individuals when their attribute preferences are considered.
The ability of PLS-SEM to directly estimate the importance weights for attributes as a whole, rather than merely for the attributes’ levels, and to compute fixed point (i.e., determinant) respondent-specific latent variable scores applicable to attributes has important implications. We outline in this article how PLS-SEM can be used to estimate DCMs pertaining to rational, optimizing (i.e., utility maximizing) decision-making. We argue, however, that PLS-SEM can also serve to estimate DCMs relating to pragmatic, heuristic decision-making. That is, whereas traditional DCM methods have been applied to assess such decision-making (Bateman et al. 2017) but without explicitly considering the fact that relative attribute impacts cannot be inferred directly from ensuing parameter estimates (Lancsar et al. 2007), PLS-SEM is an analytical approach for doing so but with the advantage of inferring directly the attributes’ relative impacts. Furthermore, the advances in PLS-SEM (e.g., analysis of observable and unobservable heterogeneity, mediator, moderator and nonlinear effects analyses) also enable identification and assessment of decision-making to distinguish rational, optimizing decisions from heuristic, pragmatic ones, when parameter estimations for attributes as a whole are crucial. Therefore, combining the quality of DCE data with the analysis features of PLS-SEM represents a useful approach to assess discrete choices and specifically, when the underlying decision making—irrespective of whether rational, optimizing or pragmatic, heuristic—requires understanding of relative attribute impacts rather than attribute level effects. Moreover, although not explored in this article, DCM, which that employs PLS-SEM to DCE data, provides a basis when, for example, incorporating latent class analyses methods to reveal differences in decision-making as it applies to managers themselves (Lin et al. 2016) and a variety of their stakeholders such as alliance partners (e.g., Gudergan et al. 2016) or customers (e.g., Mathies et al. 2013).
The remainder of the article is organized as follows: In Sect. 2, we describe DCM and LPMs in general as a backdrop for illustrating our application of PLS-SEM to DCE data. Next, we introduce the variance-based PLS-SEM method and its features to estimate models by indicator data alone. Drawing on these foundations, we specify four steps to estimate PLS path models with binary indicator data obtained from a DCE. In Sect. 3, we illustrate the application of PLS-SEM to estimate importance weights using DCE data that capture stated preferences for selected retailers. We then compare the PLS-SEM estimations from this illustrative application with the DCM’s traditional linear probability model estimations. We find that both approaches provide almost identical parameter estimates, which further substantiates the suitability of PLS-SEM for DCM analysis when drawing on DCE data. In Sect. 4, we discuss the implications of this use, and then offer overall conclusions in Sect. 5, where we also outline avenues for further research.
2 Using PLS-SEM on DCE data
2.1 Discrete choice modeling and linear probability model estimation
The fundamental DCM is based on Luce’s axioms of random utility theory (RUT), which was later formalized by McFadden (1974). Accordingly, DCM is commonly considered to rely on the assumptions of economic rationality and utility maximization (Hall et al. 2004). Based on these principles, DCM can be specified as follows: For a decision maker k, the utility of the alternative i is a latent variable consisting of a systematic component vik and a stochastic component ɛik (Train 2009), where \( U_{ik} = v_{ik} + \varepsilon_{ik} \). The objective of the decision maker is to maximize the utility: \( \hbox{max} \;U_{ik} (v_{ik} , \varepsilon_{ik} ) \). Thereby, the systematic component consists of a vector zik, which contains the attributes of the alternative, and a vector sk which contains the attributes of the decision maker, where \( v_{ik} = v_{ik} (z_{ik} , s_{k} ) \). The stochastic component contains factors, which influence the utility of an alternative but are not part of the vectors zik and sk. The factors are, for example, unobservable characteristics of the decision maker, and the alternative or measurement errors (Ben-Akiva and Lerman 1985). These factors comprise the stochastic component \( \varepsilon_{ik} = \varepsilon_{ik} \left( { z_{ik}^{*} , s_{k}^{*} ,\delta_{ik} } \right) \), with zik* = unobservable characteristics of the alternative; sk* = unobservable characteristics of the decision maker, and δik = measurement error. The choice of an alternative is assumed to reflect the latent utility of the alternative (Samuelson 1948), and is the probability Pik for decision maker k, of choosing an alternative i from the set equal to the probability that Uik from the alternative i, is larger than the utility of alternatives Ujk in set Ak:
Accordingly:
It is further assumed that the stochastic components are independent and identically Gumbel distributed, as a result of integrating over the error term the choice probability of the logit and probit model (Ben-Akiva and Lerman 1985; Train 2009):
Different distributional assumptions regarding the error component are premised on the utility characteristics of the alternative, where the decision maker’s preferences may lead to the adaptation of specific models such as probit or logit (Albers et al. 2007; Gensler 2003). Kahneman and Tversky (1979), Adamowicz et al. (2008), and others, show that customer choices are not necessarily consistent with RUT. Cognitive processes play an important role in customer choice (McFadden 2001), but they are difficult to integrate into classical choice models. As a result, the combination of data sources (Train 2009), the identification of heterogeneity, the use of segmentation criteria (Gensler 2003), and the development of suitable experimental designs (Huber and Zwerina 1996), are often identified as potentially problematic aspects when deciding on model selection.
While researchers widely apply logit, probit and multinomial logit (MNL) models for the estimation of DCMs, LPMs may represent a viable alternative (e.g., Goldfarb and Tucker 2011a; b). LPMs draw on simple ordinary least squares (OLS) regressions to determine the impact of independent variables x on the probability (Pr) of an outcome y. More specifically, let y be a dichotomous variable taking on the value 1 if an event occurred (product was chosen, performance was deemed satisfactory, etc.) and 0 if it did not occur. The LPM then uses OLS to estimate
with the usual assumptions about the error term ɛ. Since
LPMs calculate the probability that an event occurs and also estimate regression coefficients that represent the chance of choosing the choice alternative, given a unit change in the independent variable (Louviere et al. 2000, Chapter 3, Appendix B3). The major advantage of LPMs is their relatively straightforward estimation and commonsense interpretation of results.
In binary choice situations, however, it is important to consider certain caveats (Louviere et al. 2000, Chapter 3, Appendix B3). First, LPMs can predict probabilities at less than 0 or greater than 1. Second, the residuals of LPMs applied to binary choice data are by definition heteroscedastic and non-normally distributed, implying that robust standard errors must be used, and when small samples are involved inference cannot be based on the t test, which assumes normality. As an alternative, bias-corrected and accelerated (BCa) bootstrapped confidence intervals for significance testing may be used (Davison and Hinkley 1997; Efron and Tibshirani 1993). MNL models overcome the issues of LPMs by assuming
with G(*) being the cumulative distribution function (CDF) of the logistic or normal density function, respectively. The parameters of the MNL models are usually estimated using maximum likelihood (ML) techniques. As a result, one obtains the DCM estimates for every attribute level. The sign and size of the coefficients indicate the positive or negative utility and the magnitude of each attribute level (Louviere et al. 2000, Chapter 3). The utility differences of an attribute’s levels (i.e., the range between the maximum and minimum level) indicate the relative preference and importance of an attribute (Zhang et al. 2015). In contrast, the linear probability model is widely used in empirical research as a simple to compute but ad-hoc approximation to what is widely regarded as more theoretically appropriate nonlinear discrete choice models (Heckman and Snyder 1996). The specific characteristics of LPMs and the relative ease by which nonlinear ML models, such as logit and probit models, can be estimated have largely contributed to the notion that the linear logit method is inferior, particularly when explanatory variables are continuous (Louviere et al. 2000; Appendix B3).
While consistent estimation of the LPM may be difficult, it does not immediately imply that either a probit, logit or MNL model is the correct specification of the probability model, since it may be reasonable to assume that probabilities are generated from bounded linear decision rules. Theoretical rationalizations for the LPM are evidenced in Rosenthal (1989), Heckman and Snyder (1997), and Horrace and Oaxaca (2006). Moreover, Heckman and Snyder (1996) show that, by relaxing the artificial convention in RUT, the shocks to preferences are identically distributed, and LPMs can indeed be rationalized as random utility models (i.e., models where rational decision makers maximize the random utilities they derive from various outcomes).
Over the last decade, researchers have begun reconsidering the use of LPMs. For instance, Goldfarb and Tucker (2011a) and Goldfarb and Tucker (2011b) use LPMs to estimate models with over ten thousand fixed effects, noting that computational limitations prevented the estimation of a logit model on the full data set. More specifically, they noted that “the mass point of [the] dependent variable is far from 0 or 1 and […] [the] covariates are almost all binary variables” (Goldfarb and Tucker 2011a, p. 394). As a result, LPMs have advantages for capturing partial effects on the response probability and for predictive purposes.
2.2 The use of categorical and DCE data in PLS-SEM
The PLS-SEM method facilitates the estimation of path models with latent variables and linear equations (Wold 1982). The model estimation uses indicator data and an alternating least squares algorithm, which is subject to predictor specification (Apel and Wold 1982). The objective of the algorithm is to maximize the explained variance of the dependent latent variables in the PLS path model. As a result, the method calculates fixed point (i.e., determinant) scores for the latent variables, which represent a linear combination of the responses for indicators of each construct’s measurement model. Using the indicator data, it is possible to estimate the partial ordinary least squares (OLS) regressions in the PLS path model.
To further introduce the PLS-SEM method, we introduce a stylized simple PLS path model (Fig. 1). The indicators (i.e., x1 to x9), which are also referred to as manifest variables, are assigned to the measurement models of the latent variables (i.e., Y1 to Y3), which are also referred to as constructs. The estimated relationships in the measurement models (i.e., between the indicators and the constructs) are known as outer weights (i.e., w1 to w9). In the inner model, which is also referred to as the structural model, the weights (i.e., p1 to p3), represent estimated path relationships between the constructs. The error term (i.e., z2 and z3), denotes the amount of unexplained variance of the dependent variables for each partial regression model. More specifically, the PLS path model example, as shown in Fig. 1, consists of two partial regression models in the inner model (i.e., Y2 regressed on Y1 and Y3 regressed on Y1 and Y2).
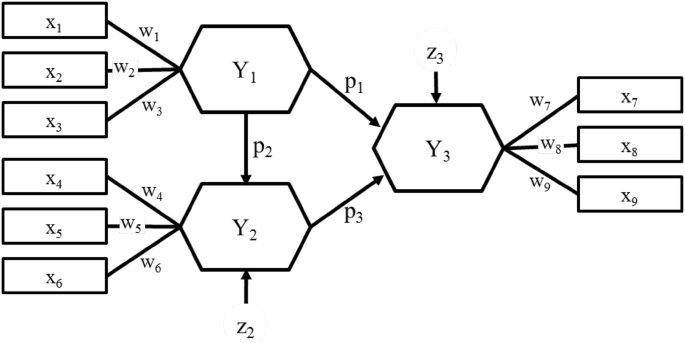
PLS path model
Authors such as Dijkstra (2010), Esposito Vinzi and Russolillo (2013), Lohmöller (1989), Wold (1982) provide a technical introduction to PLS-SEM; and Chin (2010), Mateos-Aparicio (2011), Rigdon (2013), Sarstedt et al. (2017a) offer non-technical introductions to PLS-SEM. Review studies on the use of PLS-SEM in various business research disciplines such as accounting (Lee et al. 2011; Nitzl 2016), family business (Sarstedt et al. 2014), group and organization management (Sosik et al. 2009), hospitality management (Ali et al. 2018), human resource management (Ringle et al. 2018), information systems (Hair et al. 2017a; Ringle et al. 2012), international marketing research (Henseler et al. 2009; Richter et al. 2016), marketing (Hair et al. 2012b), operations management (Peng and Lai 2012), psychology (Willaby et al. 2015), strategic management (Hair et al. 2012a), supply chain management (Kaufmann and Gaeckler 2015), and tourism (do Valle and Assaker 2016) provide a good orientation into the application of PLS-SEM.
PLS-SEM builds on OLS regression and its linear equations are applicable to metric and/or quasi-metric (i.e., interval-scaled) variables, which permit linear transformations (Hair et al. 2017b). Business research, however, often includes categorical and ordinal-scaled variables in empirical studies and experimental designs (e.g., Lu et al. 2017). For these type of data, researchers cannot apply the standard procedures of linear model estimation and results interpretation. While recent work has started exploring how to use PLS-SEM when drawing on ordinal and categorical data (Bodoff and Ho 2016; Cantaluppi and Boari 2016; Jakobowicz and Derquenne 2007; Russolillo 2012; Schuberth et al. 2018), that work provides only a limited solution and, importantly, does not suitably account for the early works of Bertholet and Wold (1984) and Lohmöller (1989, Chapter 4). These authors had already proposed an extension of the PLS-SEM approach that makes it applicable to categorical variables. In the discussion that follows, we refer to the extended PLS-SEM approach of these authors, since DCE data characteristics correspond to their data requirements.
One particular type of categorical variable encompasses the Boolean variable, which only has values of zero or one. A block of Boolean variables replaces a categorical variable (e.g., a block of five Boolean variables represents the five types of a categorical variable). In other words, across all types of a categorical variables, only one of the respective Boolean block variables has the value one and all others zero. The Boolean variables become the indicators of a categorical construct (i.e., the Boolean block) and the categorical constructs can be included in the partial regressions of the PLS path model. When using categorical scales in PLS-SEM’s partial linear regression models, in keeping with Pearson’s tradition, the analyses follow the assumption of an underlying continuum (i.e., without distributional assumptions).Footnote 1 As a result, for the PLS path model, we obtain a super contingency table (Lohmöller 1989, Chapter 4). When considering, for example, a PLS path model that consists of two categorical constructs (i.e., two Boolean blocks), we obtain a super matrix, which includes the bivariate relative frequency (i.e., the contingency table or the super contingency table, as it can contain the pairwise contingencies of even more than two categorical variables).
The PLS-SEM approach to super-contingency tables has been outlined by Bertholet and Wold (1984), who along with Lohmöller (1989, Chapter 4), show that the basic properties of PLS-SEM carry over to contingency tables (also see Tenenhaus 2004). Moreover, when applying the categorical scaling procedure in PLS-SEM, only the correlations between the latent variables are taken into account. The objective of the model estimation is to maximize the weighted sum of all correlations and the least squares approach generates a solution that meets this maximization criterion. In PLS-SEM, the correlations between the latent variables are modeled, estimated, and explained by a system of linear relations (i.e., by the PLS path model).
When explaining categorical scaling in PLS-SEM, Lohmöller (1989, Chapter 4) refers to other approaches such as raw scaling and optimal scaling as part of the PLS-SEM algorithm. A key question connected with these scaling alternatives is the use of Mode A and Mode B model estimations in PLS-SEM relating to orthogonal indicator data (Wold 1982). While a Mode A block uses single regressions for the weights estimations between the latent variable and its indicators, a Mode B block uses a multiple regression model to regress the latent variables on their indicators. But the Boolean variables of a categorical construct’s Boolean block always sum to unity, and therefore, introduce singularities into the analysis. Thus, the singularity issues of Boolean blocks prohibit the application of Mode B. Whenever the indicator data are not orthogonal, and we are left with choosing between Mode A and Mode B in relation to the contingency table analysis, Lohmöller (1989, Chapter 4) recommends Mode A to be chosen in most instances. As such, the loss function minimization of the PLS-SEM algorithm includes the indicator variables’ variance of a Mode A block in a redundancy model (i.e., the PLS path model transforms into a principal predictor model, which extracts the solution of the categorical scaling method). But when a PLS-SEM analysis is run, model estimations using Mode A and Mode B provide identical results for a block of orthonormal variables (Lohmöller 1984). The term orthonormal denotes that the indicators are uncorrelated (i.e., orthogonal) and standardized to unit variance (i.e., normal). Otherwise, when the data is not orthonormal, the distinction between Mode A and Mode B estimation can be placed outside the estimation procedure. Thus, while all Mode B blocks are orthonormalized prior to the iteration phase and transformed back following the iterations phase, all Mode A blocks are transformed by an identity, so that within the iteration no distinction between Mode A and Mode B blocks needs to be made.
Under these considerations, as Lohmöller (1989, Chapter 4) shows, PLS path models using categorical indicator data and multiple latent variables can be estimated with the standard PLS-SEM algorithm. The results of outer weights/loadings and inner weights must be transformed, however, to the metric of the Boolean variables (i.e., the metric of interpretation). Moreover, when the categorical data matrix is used as an input, which the PLS-SEM method standardizes, the solution of the dummy variables must be rescaled to the correct metric. When using standardized data, the rescaling of the outer weights wk uses the outer weights estimation \( \tilde{w}_{k} \) and divides them by the square root of the original indicator data’s mean value mk, whereby k represents the indicator number per Boolean block:
Similarly, one obtains the rescaled results of the structural relationships pk by multiplying the estimated values \( \tilde{p}_{k} \) by the square root of the original indicator data’s mean value mk:
In summary, the PLS path model estimation of categorical variables requires that the following steps be followed:
-
1.
[Model] When creating the PLS path model, use Boolean blocks for each categorical variable, whereby a Boolean variable represents each category.
-
2.
[Data] Use orthonormal data, that have no correlations between the Boolean indicators and that are standardized to unit variance.
-
3.
[Estimation] When data is orthonormal, Mode A and Mode B model estimations include the same results; thus, the standard PLS-SEM algorithm allows the estimation of PLS path models using categorical indicator data and multiple latent variables.
-
4.
[Rescaling] A last step involves the transformation of the estimated inner and outer weights and outer loadings into the metric of the Boolean variables (i.e., the metric of interpretation).
The characteristics of DCE data match entirely the use of categorical data in PLS-SEM. In PLS-SEM, besides the single-item Boolean choice construct (i.e., the endogenous latent variable in the structural model), the other constructs represent the attributes (i.e., the exogenous latent variables). The attribute level data, which usually are Boolean variables in DCM, become the indicators of the attribute constructs (i.e., the attribute constructs represent a Boolean block), as shown in Fig. 2. The experimental design of DCEs usually ensures that the attribute level data are orthogonal. Hence, when using DCE data in PLS-SEM, the Boolean blocks of (categorical) attributes build on orthogonal indicator data (i.e., the attribute levels). Note that when the PLS path model estimation uses orthogonal indicator data, the distinction between Mode A and Mode B measurement of constructs (see Wold 1982) becomes obsolete since results are identical in this kind of situation. Lohmöller (1989, Chapter 4) uses the approach to estimate a PLS path model where the manifest variables are partly considered as categorical and partly as interval-scaled to explain a binary single-item target construct.

PLS path model using DCE data
The use of DCE data to estimate a PLS path model meets the four steps and requirements of Bertholet and Wold’s (1984) and Lohmöller’s (1989, Chapter 4) categorical variables approach to PLS-SEM. The requirements are: (1) while the choice variable represents a Boolean single-item construct, the attribute level data allow establishing Boolean blocks; (2) the experimental design of DCE data ensures that the attribute level data is orthogonal; after standardization, the data is orthonormal; (3) the orthonormal DCE data permits the use of the PLS-SEM algorithm to estimate the model, whereby Mode A and Mode B provide (almost) identical results; and (4) the mean value of the Boolean variables allows rescaling of the estimated coefficients of the Boolean blocks in the outer and inner PLS path model (Eqs. 8 and 9). With regard to step (4), the experimental design of the DCE data usually ensures that the analysis includes an equal number of each attribute level (e.g., Figure 2, where the four attribute levels of Attribute 1 each have a mean value of 0.25).
Figure 3 summarizes the process of using DCE data in PLS-SEM. We adapt this approach to estimate PLS path models with DCE data. Thereby, the latent variables in the PLS path models summarize attributes across their blocks of indicators, which represent the specific attribute levels. The relationship of the attribute levels on the construct (e.g., attr11 in Fig. 2) depicts its relevance for the attribute. If ordinal or interval attribute levels have been used for a certain attribute (i.e., each indicator represents a certain data point on the ordinal or interval scale), the experimental design of the DCE data ensures that the model estimation results (i.e., the outer weights) build on the appropriate distance between the attribute levels, which usually are not equidistant. Another advantage of using PLS-SEM on DCE data concerns the estimations for the attribute as a whole (e.g., ATTR1 in Fig. 2) on the target constructs (i.e., the choice variable). Thereby, the attribute, which plays a particularly important role for the choice decision, becomes evident. Moreover, PLS-SEM provides latent variables scores for the attributes (e.g., ATTR1 in Fig. 2). These data can be used for complementary PLS-SEM analyses such as prediction-oriented results assessment (Shmueli et al. 2016) or latent class segmentation using FIMIX-PLS (Sarstedt et al. 2017b).

DCE data use in PLS-SEM
3 Illustration
3.1 DCE data
The illustration in this article serves to demonstrate that PLS-SEM can be used for the analysis of DCE data in DCM. In the following, we briefly describe the experimental design and the DCE data, on which this illustration draws. We then outline the PLS-SEM analysis and present ensuing results, and conclude with comparing these results with those estimated using traditional DCM analysis.
The illustrative example is a typical DCM application. The management of a major retailer in rural Australia was interested to reveal those characteristics of their operations that were more or less important to their customers. For this purpose, they specified ten key attributes such as product range, staff product knowledge, and opening hours (Table 4 in the Appendix). Each of these attributes was further defined by specific attribute levels. The DCM analysis allows revealing which attribute level has the highest effect and, thus, the highest impact on the customers’ choice concerning rural retailer. Based on these findings (i.e., the rank-order impact of attribute levels), the management of the rural retailer can optimize their operations to effectively run their business in accordance with the choice behavior of their customers and, thereby, improve their competitiveness.
The data were collected as part of a larger study that focused on the identification of the importance of attributes that retailers in rural Australia could operationally influence. In this illustrative use of PLS-SEM for DCM in this article, we draw on DCE data relating to the choice of whether or not to buy dog food from a certain retailer, out of a set of two alternative retailers. The data is comprised of 4288 valid observations from 268 respondents. The experimental design to obtain DCE data involved identification of those attributes that mattered to respondents and specification of realistic and meaningful attribute levels. The next stage was the generation of hypothetical alternatives and combinations of the attributes with certain levels to create choice sets. Focus group research, involving customers of dog food from rural retailers, served to identify an initial set of relevant attributes. To further prioritize which attributes mattered most from the rather large list that had been identified from the focus group research, we carried out best–worst scaling (BWS; Louviere et al. 2013, 2015) research. Based on the outputs from the BWS research and discussions with the management of a retailer, we identified a hierarchy (i.e., a ranking) of attributes that allowed selecting those that appeared to be important to customers and that retailers could operationally influence. Further focus group research and also discussions with the management of that same retailer then served to assign attribute levels. This illustrative study considers 14 attributes of which six have four levels and eight have two levels (Table 4 in the Appendix).
The creation of choice sets for the elicitation of the DCE data was based on a fractional factorial main effects experimental design, followed by a partitioning into 48 blocks. This resulted in each survey respondent receiving two choice task sets. The first choice task set comprised eight choice sets with each choice set containing two alternatives from which to choose. Each of the alternatives provided retailer descriptions that varied based on the extreme levels of each attribute, meaning that in a two-level attribute, the respondent was shown level 1 or level 2; and in a four-level attribute, the respondent was shown level 1 or level 4, whereas levels 2 and 3 were not shown, hence referred to as an end-point design. For each of the eight choice sets, the survey respondents were asked to choose either RetailerA or RetailerB, based on which appealed most to them. The second choice task set was comprised of eight choice sets with each choice set containing two alternatives from which to choose. Each of the alternatives provided retailer descriptions that varied based on any of the attribute levels, hence referred to as a multi-level design. For each of the eight choice sets, the survey respondents were asked to choose RetailerA or RetailerB, based on which was most appealing to them.
3.2 Using PLS-SEM to analyze DCE data in DCM
To use the DCE data with PLS-SEM, in Step 1 [Model], we need to develop a PLS path model as shown in Fig. 2. The choice variable becomes the single-item target construct (i.e., CHOICE) in this model. The outer weights relationship (specified as 1) between the single choice indicator and the CHOICE construct indicates that their scores are identical. The well-known notion of caution for using a single item construct in SEM (Diamantopoulos et al. 2012; Sarstedt et al. 2016a) does not apply in the case of the binary choice variable obtained from discrete choice experiments. The main reasons are the nature of the target construct, which represents a clear-cut binary decision (i.e., chose or did not choose), and the experimental design for the data collection, which reduces potential reliability issues.
The independent constructs (i.e., ATTR1 and ATTR2) in this model represent main attributes that explain the dependent CHOICE construct. The indicators of each attribute stem from the attribute level variables of the discrete choice experiment data. In other words, each attribute (e.g., ATTR1) is formed by its attribute level data (e.g., attr11, attr12, attr13, and attr14). In the inner model, the size of the standardized OLS regression coefficients p1 and p2 indicate the importance of each main attribute for the CHOICE explanation. Similarly, the standardized OLS regression coefficients of the outer weights (e.g., w11, w12, w13) indicate the relative importance of each attribute level in forming the attribute. Both the inner model and outer model coefficients can have positive or negative signs. The multiplication of the outer and inner coefficients provides the total effect of each attribute level on CHOICE.
When using PLS-SEM to estimate the composite indicator models of the attributes, one selects between correlation weights (Mode A) and regression weights (Mode B) for the model estimation (Sarstedt et al. 2016b). Each method of model estimation has advantages and disadvantages (Becker et al. 2013a). Since the attribute level data of a specific attribute are orthogonal in discrete choice experiments, the PLS-SEM model estimations are identical when using correlation weights or regression weights. In this application, we use correlation weights for the PLS-SEM estimation (i.e., Mode A), as Lohmöller (1989, Chapter 4) recommends.
The DCE data for this illustration allows us to establish a PLS path model like the one shown in Fig. 2, except that is considerably more complex. In total, the retailer choice example includes 14 attributes and each attribute has two or four attribute levels. Table 4 (in the Appendix) shows the names of the attributes and depicts their attribute levels. The experimental design of this example provides orthonormal data, which have no correlations between the Boolean indicators. An inspection of the correlation matrix, in Step 2 [Data], confirms this expectation. In Step 3 [Estimation], we standardize the data to unit variance and use the PLS-SEM algorithm (Mode A). We estimate the PLS path model using the SmartPLS 3 software (Ringle et al. 2015). Table 1 shows the results.
In the inner model, ATTR10 (i.e., stock availability) and ATTR2 (i.e., staff product knowledge) have the strongest effect on CHOICE, followed by ATTR4 (i.e., independence of advice) and ATTR9 (i.e., product range). The outer weights indicate the importance of an attribute level for the attribute. For instance, the lowest and highest staff product knowledge levels (i.e., attr2.1 and attr2.4) have the strongest negative and positive effects on ATTR2.
To obtain the impact of each attribute level on CHOICE, one multiplies the outer weights by the inner model coefficients (e.g., att11 - > CHOICE = w11 × p1; Fig. 2). Then, in Step 4 [Re-scaling], we conduct the adjustment of PLS-SEM coefficients for PLS path models with Boolean, categorical, and interval-scaled manifest variables as proposed by Lohmöller (1989, Chapter 4). Table 2 shows the corresponding results. We find that attribute levels attr10.1 versus attr10.4 (often stock has to be ordered in versus stock nearly always available), attr2.1 versus attr2.4 (no real product knowledge versus extensive product knowledge of the personnel), attr4.1 versus attr4.2 (unsure whether advice may be biased versus trusted to provide unbiased advice), and attr9.1 versus attr9.2 (limited versus wide range of brands) have the highest effect on choice. These findings on the attribute levels mirror the relevance of the main attributes as depicted by the inner model relationships (Table 1).
3.3 Results Comparison and Discussion
To assess the PLS-SEM estimations, we draw on the conditional logit estimation of the DCM (Louviere et al. 2000) using the STATA software (StataCorp 2015). The estimations include the positive and negative effects of each attribute level on CHOICE (Table 2). As a typical DCM result, we find that some attribute levels have a particularly strong effect on CHOICE (e.g., attr2.1 and attr2.4, which are related to low and high product knowledge of the staff) while others have almost no impact (e.g., attr8.1 and attr8.2, which are related to the retailer’s branding).
We compare the conditional logit estimations of the DCM with the rescaled PLS-SEM estimations of the total effect (i.e., the outer model coefficients multiplied with the inner model coefficient; see Fig. 2 and Table 1). The PLS-SEM estimations and the conditional logit estimations then have the same (i.e., expected) signs. Also, the estimations for the effects of the attribute levels on choice differ only slightly in their values. The mean absolute difference of the conditional logit estimation and the PLS-SEM estimation of the DCM has a value of 0.019. The differences can be explained based on the different estimators (i.e., ML-based conditional logit model estimation versus OLS-based PLS-SEM estimation), the slightly imperfect orthogonal data, and different rounding, especially in combination with the multiplication of outer and inner model coefficients in PLS-SEM. However, the signs, rank-order of estimated coefficients, and their final values, lead to the same outcome and interpretation.
An often used approach to interpret results from estimations of DCMs from DCE data are the importance weights (Louviere and Islam 2008; Schlereth and Schulz 2014). The idea is to depict the relative importance of the attribute as a whole based on the strength of the estimated coefficients for the attribute levels. More specifically, for each attribute, one computes the span of the attribute level results. The importance weight of an attribute is a percentage value that results from the span of its attribute levels divided by the sum of all attributes’ spans (Zhang et al. 2015). Table 3 shows the importance weights based on the attribute level results when using the conditional logit model and PLS-SEM rescaled total effects (as shown in Table 2). For this kind of analysis, we also find that the results obtained by the conditional logit and PLS-SEM estimations differ only marginally.
In an additional analysis, we investigate if the inner model PLS-SEM estimations (e.g., for p1 and p2 in Fig. 2) are comparable with the obtained importance weights, and thus can be directly used to assess the relevance and importance of the whole attribute to explain the choice. For this purpose, we compute the importance weights of the inner model in the same way as we did for the attribute levels, which is in line with the importance weights computation in PLS-SEM that Becker et al. (2012) proposed. We also find that the results only differ marginally (Table 3). Hence, to analyze the importance of an entire attribute for the choice decisions, one could directly interpret the inner model PLS-SEM coefficients as shown in Table 1. When focusing on the attributes instead of the attribute levels, both results (i.e., the importance weights and the inner model PLS-SEM coefficients) substantiate that ATTR2 (i.e., the staff product knowledge) and ATTR10 (i.e., stock availability) have the highest importance weight and inner model effect on CHOICE, followed by, ATTR4 (i.e., independence of advice) and ATTR12 (i.e., professional advisory service).
This example shows how the use of DCE data in PLS-SEM allows to directly derive values of relative attribute impacts that capture the attribute as a whole (rather than attribute levels). While generating these values has theoretical implications, revealing the specific decision-making rules (i.e., based on attributes as a whole), which various stakeholders deploy, allows managers to better deal with them and to tail activities towards them. For instance, if payment terms do not matter, then such attribute can be disregarded when determining suitable business models that can be valuable in certain markets. On the other hand, knowing that other attributes have a significant impact on how stakeholders react implies that business models can be conceived in a way that they may incorporate novel, but superior, ways of enhancing value to stakeholders. This is a noteworthy advantage that comes with an interpretation of attributes as a whole for managerial decision making rather than reverting to design-specific attribute levels. Moreover, analyzing the results of a multitude of attribute levels (40 in this example) imposes a complexity when comparing their relatively small results across different attribute dimensions. Instead, the managers can now focus on a considerably smaller number of attributes as a whole (14 in this example), which entail more pronounced differences in their impact on choice. Hence, not only does an analysis that considers the attribute as a whole, rather than one that is based on attribute levels, provide less constraints and greater flexibility in considering novel ways of increasing value in regard to certain attributes, it also comes with less complexity simplifying managerial decision making. Finally, advanced PLS-SEM methods (e.g., segmentation analyses) allow generating group-specific insights through accounting for a priori known differences between stakeholder groups based on observable characteristics or through uncovering stakeholder groups that differ in the relative attribute impact pertaining to them. In turn, managers can develop group-specific programs to have greatest impact.
4 Summary and implications
DCM can draw on revealed preference data to explain choices pertaining to actual alternatives, stated preference data to explain choices related to hypothetical alternatives, or both. When drawing on stated preference data (i.e., on DCE data), experimental designs for the elicitation of attribute level preferences allow for the formation of binary indicators that are orthogonal. These DCE data characteristics are advantageous when applying multivariate analysis methods.
While the PLS-SEM method has become popular to estimate complex models with latent variables, its goal to explain and predict a target construct of interest makes it particularly useful for estimating DCMs. For this purpose, a block of indicators per measurement model establishes a latent variable. Consequently, DCE data represent a suitable foundation for the estimation of PLS path models, which this paper illustrates. We outline that PLS-SEM offers features to estimate PLS path models when employing binary indicator data only. For this purpose, the researcher must create a PLS path model that only uses Boolean blocks for each categorical variable, whereby a Boolean indicator variable represents each category (Step 1, Model). The PLS path model estimation uses orthonormal data, which have no correlations between the Boolean indicators and that are standardized to unit variance (Step 2, Data). Then, the standard PLS-SEM algorithm estimates PLS path models using categorical indicator data and multiple latent variables. More specifically, when the data is orthonormal, Mode A and Mode B model estimations produce the same results (Step 3, Estimation). Lastly (Step 4, Rescaling), the estimated inner and outer weights and outer loadings require transformation into the metric of the Boolean variables (i.e., the metric of interpretation).
Following these four steps, PLS-SEM estimations yield results that are similar to those obtained for the attribute levels when using conditional logit model estimations. Also, the importance weights for the relevance of attributes as a whole, as typically determined in DCM through subsequent calculations, match the inner PLS path model estimations. We illustrate these notions by drawing on an empirical example that uses DCE data concerning retailer choice. Specifically, we leverage this illustrative example to compare estimates of a conditional logit model employing STATA with those of PLS-SEM employing SmartPLS 3. The results of the traditional DCM estimation using conditional logit models and the PLS-SEM method reveal negligible differences (i.e., of a mean absolute results difference value of 0.019) for this illustrative example. These differences are likely attributable to rounding errors and negligible design and error term distribution problems. Therefore, based on the analytical arguments we have outlined above, and the findings from the illustrative example using PLS-SEM, we conclude that DCMs can be estimated using PLS-SEM when drawing on DCE data.
Demonstrating the capacity of PLS-SEM to estimate models using DCE data has several advantages. First, besides the analyses on the numerous and relative specific attribute levels, it is often beneficial to reduce the complexity for decision-making and to focus conclusions on attributes as a whole rather than the attributes’ levels. The PLS-SEM results directly reveal the relative importance weights for attributes as a whole for the choice by the inner model relationships, rather than calculating them from importance weights estimated for attribute levels. Further, the outer weights relationships in the PLS path model represent the relative importance per attribute level (i.e., the indicators). Moreover, the total effects of the attribute levels on the choice constructs (i.e., the product of the outer and inner relationships) facilitate comparing their relative importance across all attributes. Thereby, the PLS-SEM results provide a comprehensive picture of the relevant attributes for advancing understanding about the decision-making that characterizes individuals, while considering their preferences for attributes.
Second, when drawing choice behavior related conclusions for the whole attribute, PLS-SEM is advantageous since the method computes latent variable scores, which entail a fixed point (i.e., determinant) estimate for every respondent. Using these latent variables scores, the researcher can conduct respondent-specific analyses for the explanation and prediction of the decision maker’s choice behavior, not only on the attribute level but also for the attribute as a whole (for prediction-oriented PLS-SEM analyses see, for instance, Shmueli et al. 2016). Also, the latent variable scores can be used to run complementary statistical and PLS-SEM analyses. For example, the structural model relationships can be examined for the presence of unobserved heterogeneity characterized by the attributes as a whole and their effects on the choice behavior, rather than at the individual attribute level. PLS-SEM segmentation approaches such as finite mixture partial least square (FIMIX-PLS; Hahn et al. 2002) and partial least square prediction oriented segmentation (PLS-POS; Becker et al. 2013b) support this kind of analysis. Alternatively, the use of permutation-based multigroup analysis (Chin and Dibbern 2010) or moderator analysis (Becker et al. 2018) makes it possible to examine differences among decision makers based on observed grouping variables such as socio-demographic variables. Another possible complementary analysis, which often is of interest in applications, allows obtaining results for non-linear (i.e., quadratic) effects between the attribute constructs and the choice behavior in the structural model when using PLS-SEM (Hair et al. 2018). These capacities of the OLS-based PLS-SEM method extend the established use of LPM estimations in DCM.
5 Conclusions and future research
The objective of this article was to demonstrate the usefulness of PLS-SEM for the analysis of DCE data in DCM to estimate directly the importance weight of the attribute as a whole. Analytical arguments were provided that substantiate why and how PLS-SEM is applicable for DCM and the direct estimation of important weights of attributes as a whole. We then showed that DCMs can be estimated using PLS-SEM when drawing on DCE data, and that the estimations are largely consistent with those that are based on traditional DCM analyses drawing on LPMs. Therefore, we argue PLS-SEM can be used to estimate DCMs pertaining to rational, optimizing decision-making, as we assumed in the illustrative application described in this article, but also those relating to pragmatic, heuristic decision-making. The advances in PLS-SEM (e.g., analysis of observable and unobservable heterogeneity, mediator and moderator analysis, analysis of nonlinear effects) enable identification and assessment of decision-making to distinguish rational and optimizing (i.e., utility maximizing) decisions from heuristic and pragmatic ones, when parameter estimations for attributes as a whole are crucial. In addition to these implications for theory, the application of PLS-SEM for DCM also offers managerial ones. An analysis that considers the attribute as a whole, rather than one that is based on attribute levels, provides less constraints and greater flexibility in considering novel ways of increasing value in regards to certain attributes; and it also comes with less complexity simplifying managerial decision-making as it applies to all business contexts such as sourcing, investments, business models, and stakeholder programs, including customer-related ones.
This research is not without limitations, however. In fact, it represents a foundational article that demonstrates the use of DCE data in PLS-SEM, as well as PLS-SEM for DCM. Building on this foundation, we anticipate future research will further explore and exploit the advantages and opportunities of PLS-SEM in DCM. For example, a particularly fruitful area of future research is respondent-specific analysis, in combination with research on uncovering heterogeneity and multigroup analyses, when using DCE data in PLS-SEM. Data obtained from DCE usually involves multiple responses per individual. So far, PLS-SEM does not offer capabilities to account for multiple responses per individual in the analyses and model estimations. Such capabilities would be very useful to obtain individual level PLS-SEM results. This kind of extension is also appropriate for all complementary PLS-SEM analyses when using DCE data (e.g., mediation, moderation, FIMIX-PLS, PLS-POS, non-linear effects; Hair et al. 2018). For instance, accounting for multiple responses per individual is particularly important when carrying out PLS-SEM segmentation approaches to uncover unobserved heterogeneity on the individual level (i.e., an assignment to a segment involves all responses of a certain individual). Moreover, prediction-oriented analyses of PLS-SEM results (e.g., Shmueli et al. 2016) when using DCE data represents a promising avenue of future research. For this purpose, the point estimates provided by PLS-SEM (i.e., the latent variables scores) are particularly advantageous.
Finally, accounting for decision maker characteristics when using PLS-SEM in DCM to explain choice decisions is another fruitful area for further research. Consideration of socio-demographic data for this purpose is not necessarily sufficient and modeling the impact of characteristics such as the decision maker’s attitudes or values may be required (Temme et al. 2008). Attempts to account for such decision maker characteristics, so far, have been based on the covariance-based SEM approach by including latent variables as additional predictors (e.g., Ben-Akiva et al. 2002; Daly et al. 2012; Kamargianni et al. 2014; Prato et al. 2012; Rungie et al. 2012). Temme et al. (2008) further explored this by not only including latent variables as additional predictors but also by estimating a multinomial choice model and hierarchical relationships between the constructs (also see Hildebrandt et al. 2012). However, the question remains as to why past research has focused on covariance-based SEM to account for latent variables in DCM instead of drawing on variance-based PLS-SEM (Rigdon et al. 2017). The PLS-SEM approach appears to better meet the composite character of latent variables in such models (Sarstedt et al. 2016b), and may more effectively match the explanation and prediction-oriented goals of DCM, given its prediction-oriented advantages (Evermann and Tate 2016). Hence, future research can extend the use of PLS-SEM as proposed in this article when DCM estimation draws on DCE data by incorporating latent variables to model the impact of, for example, attitudes and values. This, in turn, will allow researchers to empirically determine whether the importance values, which individuals place on different attributes and which shape their preference for certain options, are conditioned by the context or customer characteristics.
Notes
For the adaption of categorical variables to PLS-SEM, one can build on either linear (i.e., adaptive) or loglinear (i.e., multiplicative) models. While loglinear models usually view the categories of a cross-classification as fixed in Yule’s tradition (i.e., the cross-product ratio of a, for instance, 2 × 2 table is not a substitute for an estimate of the true correlation coefficient of an underlying continuum), Pearson assumes an underlying continuum for a dichotomy (or a polychotomy) and multinormality.
References
Adamowicz, Wiktor, David S. Bunch, Trudy A. Cameron, Benedict G.C. Dellaert, Michael Hanneman, Michael P. Keane, Jordan J. Louviere, Robert J. Meyer, Thomas Steenburgh, and Joffre D. Swait. 2008. Behavioral frontiers in choice modeling. Marketing Letters 19: 215–228.
Albers, Sönke, Daniel Klapper, Udo Konradt, Achim Walter, and Joachim Wolf. 2007. Methodik der empirischen Forschung.
Ali, Faizan, S. Mostafa Rasoolimanesh, Marko Sarstedt, Christian M. Ringle, and Kisang Ryu. 2018. An assessment of the use of partial least squares structural equation modeling (PLS-SEM) in hospitality research. International Journal of Contemporary Hospitality Management 30: 514–538.
Amaro, Suzanne, and Paulo Duarte. 2015. An integrative model of consumers’ intentions to purchase travel online. Tourism Management 46: 64–79.
Apel, Heino, and Herman O.A. Wold. 1982. Soft modeling with latent variables in two or more dimensions: PLS estimation and testing for predictive relevance. In Systems under indirect observations: Part II, ed. K.G. Jöreskog and H. Wold, 209–247. Amsterdam: North-Holland.
Ayeh, Julian K., Au Norman, and Rob Law. 2013. Predicting the intention to use consumer-generated media for travel planning. Tourism Management 35: 132–143.
Bateman, Hazel, Christine Eckert, Fedor Iskhakov, Jordan J. Louviere, Stephen Satchell, and Susan Thorp. 2017. Default and naive diversification heuristics in annuity choice. Australian Journal of Management 42: 32–57.
Becker, Jan-Michael, Kristina Klein, and Martin Wetzels. 2012. Hierarchical latent variable models in PLS-SEM: guidelines for using reflective-formative type models. Long Range Planning 45: 359–394.
Becker, Jan-Michael, Arun Rai, and Edward E. Rigdon. 2013a. Predictive validity and formative measurement in structural equation modeling: embracing practical relevance. In 2013 Proceedings of the international conference on information systems, Milan.
Becker, Jan-Michael, Arun Rai, Christian M. Ringle, and Franziska Völckner. 2013. Discovering unobserved heterogeneity in structural equation models to avert validity threats. MIS Quarterly 37: 665–694.
Becker, Jan-Michael, Christian M. Ringle, and Marko Sarstedt. 2018. Estimating moderating effects in PLS-SEM and PLSc-SEM: interaction term generation*data treatment. Journal of Applied Structural Equation Modeling 2: 1–21.
Ben-Akiva, Moshe E., and Steven R. Lerman. 1985. Discrete choice analysis: theory and application to travel demand, vol. 9. Cambridge: MIT Press.
Ben-Akiva, Moshe, Daniel McFadden, Kenneth Train, Joan Walker, Chandra Bhat, Michel Bierlaire, Denis Bolduc, Axel Boersch-Supan, David Brownstone, David S. Bunch, Andrew Daly, Andre De Palma, Dinesh Gopinath, Anders Karlstrom, and Marcela A. Munizaga. 2002. Hybrid choice models: progress and challenges. Marketing Letters 13: 163–175.
Bertholet, Jean-Luc, and Herman O.A. Wold. 1984. Recent developments on categorical data analysis by PLS modeling. ICUS Seminar Paper, Washington, September 3–5, 1984.
Bodoff, David, and Shuk Ying Ho. 2016. Partial least squares structural equation modeling approach for analyzing a model with a binary indicator as an endogenous variable. Communications of the Association for Information Systems 38. http://aisel.aisnet.org/cais/vol38/iss31/23.
Buckley, Peter J., Timothy M. Devinney, and Jordan J. Louviere. 2007. Do managers behave the way theory suggests? A choice-theoretic examination of foreign direct investment location decision-making. Journal of International Business Studies 38: 1069–1094.
Cantaluppi, Gabriele, and Giuseppe Boari. 2016. A partial least squares algorithm handling ordinal variables. In The multiple facets of partial least squares and related methods: PLS, Paris, France, 2014, ed. H. Abdi, V. Esposito Vinzi, G. Russolillo, G. Saporta, and L. Trinchera, 295–306. Cham: Springer.
Chin, Wynne W. 2010. How to write up and report PLS analyses. In: Handbook of partial least squares: Concepts, methods and applications (Springer Handbooks of Computational Statistics Series, vol. II), Eds. Esposito Vinzi, V., Chin W.W., Henseler, J., Wang, H., pp 655–690. Springer, Heidelberg.
Chin, Wynne W., and Jens Dibbern. 2010. A permutation based procedure for multi-group PLS analysis: Results of tests of differences on simulated data and a cross cultural analysis of the sourcing of information system services between Germany and the USA. In: Handbook of partial least squares: Concepts, methods and applications (Springer Handbooks of Computational Statistics Series, vol. II), eds. Esposito Vinzi, V., Chin, W.W., Henseler, J., Wang, H., 171–193. Springer, Heidelberg.
Daly, Andrew, Stephane Hess, Bhanu Patruni, Dimitris Potoglou, and Charlene Rohr. 2012. Using ordered attitudinal indicators in a latent variable choice model: A study of the impact of security on rail travel behaviour. Transportation 39: 267–297.
Davison, Anthony C., and David V. Hinkley. 1997. Bootstrap methods and their application. Cambridge: Cambridge University Press.
Diamantopoulos, Adamantios, Marko Sarstedt, Christoph Fuchs, Petra Wilczynski, and Sebastian Kaiser. 2012. Guidelines for choosing between multi-item and single-item scales for construct measurement: A predictive validity perspective. Journal of the Academy of Marketing Science 40: 434–449.
Dijkstra, Theo K. 2010. Latent variables and indices: Herman Wold’s basic design and partial least squares. In: Handbook of Partial Least Squares: Concepts, Methods and Applications (Springer Handbooks of Computational Statistics Series, vol. II), eds. Esposito Vinzi, V., Chin, W.W., Henseler, J., Wang, H., 23–46. Heidelberg: Springer.
do Valle, Patrícia Oom, and Guy Assaker. 2016. Using partial least squares structural equation modeling in tourism research: A review of past research and recommendations for future applications. Journal of Travel Research 55: 695–708.
Efron, Bradley, and Robert J. Tibshirani. 1993. An introduction to the bootstrap. New York: Chapman & Hall.
Esposito, Vinzi, and Giorgio Russolillo Vincenzo. 2013. Partial least squares algorithms and methods. Wiley Interdisciplinary Reviews: Computational Statistics 5: 1–19.
Evermann, Joerg, and Mary Tate. 2016. Assessing the predictive performance of structural equation model estimators. Journal of Business Research 69: 4565–4582.
Gensler, Sonja. 2003. Heterogenität in der Präferenzanalyse. Ein Vergleich von Hierarchischen Bayes-Modellen und Finite-Mixture-Modellen Wiesbaden: Deutscher Universität-Verlag/GWV Fachverlage.
Goldfarb, Avi, and Catherine E. Tucker. 2011a. Online display advertising: Targeting and obtrusiveness. Marketing Science 30: 389–404.
Goldfarb, Avi, and Catherine E. Tucker. 2011b. Privacy regulation and online advertising. Management Science 57: 57–71.
Gudergan, Siegfried P., Timothy M. Devinney, and R. Susan Ellis. 2016. Cooperation and compliance in non-equity alliances. Journal of Business Research 69: 1759–1764.
Hahn, Carsten, Michael D. Johnson, Andreas Herrmann, and Frank Huber. 2002. Capturing customer heterogeneity using a finite mixture PLS approach. Schmalenbach Business Review 54: 243–269.
Hair, Joseph F., Carole L. Hollingsworth, Adriane B. Randolph, and Alain Yee Loong Chong. 2017a. An updated and expanded assessment of PLS-SEM in information systems research. Industrial Management & Data Systems 117: 442–458.
Hair, Joseph F., G. Tomas, M. Hult, Christian M. Ringle, and Marko Sarstedt. 2017b. A primer on partial least squares structural equation modeling (PLS-SEM), 2nd ed. Thousand Oaks: Sage.
Hair, Joseph F., Marko Sarstedt, Torsten M. Pieper, and Christian M. Ringle. 2012a. The use of partial least squares structural equation modeling in strategic management research: A review of past practices and recommendations for future applications. Long Range Planning 45: 320–340.
Hair, Joseph F., Marko Sarstedt, Christian M. Ringle, and Siegfried P. Gudergan. 2018. Advanced issues in partial least squares structural equation modeling (PLS-SEM). Thousand Oaks: Sage.
Hair, Joseph F., Marko Sarstedt, Christian M. Ringle, and Jeannette A. Mena. 2012b. An assessment of the use of partial least squares structural equation modeling in marketing research. Journal of the Academy of Marketing Science 40: 414–433.
Hall, Jane, Rosalie Viney, Marion Haas, and Jordan J. Louviere. 2004. Using stated preference discrete choice modeling to evaluate health care programs. Journal of Business Research 57: 1026–1032.
Heckman, James J., and James M. Snyder. 1996. Linear probability models of the demand for attributes with an empirical application to estimating the preferences of legislators. National Bureau of Economic Research Working Paper No. 5785
Heckman, James J., and James M. Snyder. 1997. Linear probability models of the demand for attributes with an empirical application to estimating the preferences of legislators. Rand Journal of Economics 28: S142–S189.
Henseler, Jörg, Christian M. Ringle, and Rudolf R. Sinkovics. 2009. The use of partial least squares path modeling in international marketing. In: Advances in international marketing, eds. Sinkovics, R.R., Ghauri, P.N., vol 20: 277–320. Emerald: Bingley.
Hensher, David A., John M. Rose, and William H. Greene. 2015. Applied choice analysis: A primer, 2nd ed. Cambridge: Cambridge University Press.
Hildebrandt, Lutz, Dirk Temme, and Marcel Paulssen. 2012. Choice modeling and SEM. In Quantitative marketing and marketing management: Marketing models and methods in theory and practice, ed. A. Diamantopoulos, W. Fritz, and L. Hildebrandt, 63–80. Wiesbaden: Gabler Verlag.
Horrace, William C., and Ronald L. Oaxaca. 2006. Results on the bias and inconsistency of ordinary least squares for the linear probability model. Economics Letters 90: 321–327.
Huber, Joel, and Klaus Zwerina. 1996. The importance of utility balance in efficient choice designs. Journal of Marketing Research 30: 307–317.
Jakobowicz, Emmanuel, and Christian Derquenne. 2007. A modified PLS Path modeling algorithm handling reflective categorical variables and a new model building strategy. Computational Statistics & Data Analysis 51: 3666–3678.
Kahneman, Daniel, and Amos Tversky. 1979. Prospect theory: Analysis of decision under risk. Econometrica 47: 263–291.
Kamargianni, Maria, Moshe E. Ben-Akiva, and Amalia Polydoropoulou. 2014. Incorporating social interaction into hybrid choice models. Transportation 41: 1263–1285.
Kaufmann, Lutz, and Julia Gaeckler. 2015. A structured review of partial least squares in supply chain management research. Journal of Purchasing and Supply Management 21: 259–272.
Lancsar, Emily, Jordan J. Louviere, and Terry N. Flynn. 2007. Several methods to investigate relative attribute impact in stated preference experiments. Social Science and Medicine 64: 1738–1753.
Lee, Lorraine, Stacie Petter, Dutch Fayard, and Shani Robinson. 2011. On the use of partial least squares path modeling in accounting research. International Journal of Accounting Information Systems 12: 305–328.
Lin, Nidthida, Timothy M. Devinney, and Tim R. Holcomb. 2016. Examining Managerial preferences and choices: The role of value creation and value appropriation drivers in strategic outsourcing. Long Range Planning 49: 706–722.
Lohmöller, Jan-Bernd. 1984. LVPLS 1.6. Lohmöller, Cologne.
Lohmöller, Jan-Bernd. 1989. Latent variable path modeling with partial least squares. Heidelberg: Physica.
Louviere, Jordan J., Terry N. Flynn, and A.A.J. Marley. 2015. Best–worst scaling: Theory, methods and applications. Cambridge: Cambridge University Press.
Louviere, Jordan J., David A. Hensher, and Joffre D. Swait. 2000. Stated choice methods: Analysis and applications. Cambridge: Cambridge University Press.
Louviere, Jordan J., and Towhidul Islam. 2008. A comparison of importance weights and willingness-to-pay measures derived from choice-based conjoint, constant sum scales and best–worst scaling. Journal of Business Research 61: 903–911.
Louviere, Jordan J., Ian Lings, Towhidul Islam, Siegfried Gudergan, and Terry N. Flynn. 2013. An introduction to the application of (case 1) best–worst scaling in marketing research. International Journal of Research in Marketing 30: 292–303.
Louviere, Jordan J., Deborah Street, Leonie Burgess, Nada Wasi, Towhidul Islam, and Anthony A.J. Marley. 2008. Modeling the choices of individual decision-makers by combining efficient choice experiment designs with extra preference information. Journal of Choice Modelling 1: 128–164.
Lu, Hui, Stephane Hess, Andrew Daly, and Charlene Rohr. 2017. Measuring the impact of alcohol multi-buy promotions on consumers’ purchase behaviour. Journal of Choice Modelling 24: 75–95.
Mateos-Aparicio, Gregoria. 2011. Partial least squares (PLS) methods: Origins, evolution, and application to social sciences. Communications in Statistics - Theory and Methods 40: 2305–2317.
Mathies, Christine, Siegfried P. Gudergan, and Paul Z. Wang. 2013. The effects of customer-centric marketing and revenue management on travelers’ choices. Journal of Travel Research 52: 479–493.
McFadden, Daniel L. 1974. Conditional logit analysis of qualitative choice behavior. In Frontiers in econometrics. Economic theory and mathematical economics, ed. P. Zarembka, 105–139. New York: Academic Press.
McFadden, Daniel L. 2001. Economic choices. American Economic Review 91: 351–378.
Nitzl, Christian. 2016. The use of partial least squares structural equation modelling (PLS-SEM) in management accounting research: Directions for future theory development. Journal of Accounting Literature 37: 19–35.
Peng, David Xiaosong, and Fujun Lai. 2012. Using partial least squares in operations management research: A practical guideline and summary of past research. Journal of Operations Management 30: 467–480.
Prato, Carlo Giacomo, Shlomo Bekhor, and Cristina Pronello. 2012. Latent variables and route choice behavior. Transportation 39: 299–319.
Richter, Nicole F., Rudolf R. Sinkovics, Christian M. Ringle, and Christopher Schlägel. 2016. A critical look at the use of SEM in international business research international marketing review 33: 376–404.
Rigdon, Edward E. 2013. Partial least squares path modeling. In: Structural equation modeling. A second course, eds. Hancock, G.R., Mueller, R.O., 2 edn, 81–116. Information Age Publishing, Charlotte.
Rigdon, Edward E., Marko Sarstedt, and Christian M. Ringle. 2017. On comparing results from CB-SEM and PLS-SEM. Five perspectives and five recommendations. Marketing ZFP 39: 4–16.
Ringle, Christian M., Marko Sarstedt, Rebecca Mitchell, and Siegfried P. Gudergan. 2018. Partial least squares structural equation modeling in HRM research. The International Journal of Human Resource Management. https://doi.org/10.1080/09585192.2017.1416655.
Ringle, Christian M., Marko Sarstedt, and Detmar W. Straub. 2012. A critical look at the use of PLS-SEM in MIS quarterly. MIS Quarterly 36: iii–xiv.
Ringle, Christian M., Sven Wende, and Jan-Michael Becker. 2015. SmartPLS 3. Bönningstedt: SmartPLS.
Rosenthal, Robert W. 1989. A bounded-rationality approach to the study of noncooperative games. International Journal of Game Theory 18: 273–292.
Rungie, Cam M., Leonard V. Coote, and Jordan J. Louviere. 2012. Latent variables in discrete choice experiments. Journal of Choice Modelling 5: 145–156.
Russolillo, Giorgio. 2012. Non-metric partial least squares. Electronic Journal of Statistics 6: 1641–1669.
Samuelson, Paul A. 1948. Consumption theory in terms of revealed preference. Economica 15: 243–253.
Sarstedt, Marko, Adamantios Diamantopoulos, and Thomas Salzberger. 2016a. Should we use single items? Better not. Journal of Business Research 69: 3199–3203.
Sarstedt, Marko, Joseph F. Hair, Christian M. Ringle, Kai O. Thiele, and Siegfried P. Gudergan. 2016b. Estimation issues with PLS and CBSEM: Where the bias lies! Journal of Business Research 69: 3998–4010.
Sarstedt, Marko, Christian M. Ringle, and Joseph F. Hair. 2017a. Partial least squares structural equation modeling. In Handbook of market research, ed. C. Homburg, M. Klarmann, and A. Vomberg. Heidelberg: Springer.
Sarstedt, Marko, Christian M. Ringle, and Joseph F. Hair. 2017b. Treating unobserved heterogeneity in PLS-SEM: A multi-method approach. In Partial least squares structural equation modeling: Basic concepts, methodological issues and applications, ed. R. Noonan and H. Latan, 197–217. Heidelberg: Springer.
Sarstedt, Marko, Christian M. Ringle, Donna Smith, Russell Reams, and Joseph F. Hair. 2014. Partial least squares structural equation modeling (PLS-SEM): A useful tool for family business researchers. Journal of Family Business Strategy 5: 105–115.
Schlereth, Christian, and Fabian Schulz. 2014. Schnelle und einfache Messung von Bedeutungsgewichten mit der Restricted-Click-Stream Analyse: Ein Vergleich mit etablierten Präferenzmessmethoden. Die Zeitschrift für betriebswirtschaftliche Forschung (zfbf) 66: 630–657.
Schuberth, Florian, Jörg Henseler, and Theo K. Dijkstra. 2018. Partial least squares path modeling using ordinal categorical indicators. Quality & Quantity 52: 9–35.
Seetharaman, A., Indu Niranjan, Nitin Patwa, and Amit Kejriwal. 2017. A study of the factors affecting the choice of investment portfolio by individual investors in Singapore. Accounting and Finance Research 6: 153–168.
Shmueli, Galit, Soumya Ray, Juan Manuel Velasquez Estrada, and Suneel Babu Chatla. 2016. The elephant in the room: Evaluating the predictive performance of PLS models. Journal of Business Research 69: 4552–4564.
Sosik, John J., Surinder S. Kahai, and Michael J. Piovoso. 2009. Silver Bullet or voodoo statistics? A primer for using the partial least squares data analytic technique in group and organization research. Group Organization Management 34: 5–36.
StataCorp. 2015. Stata statistical software: Release 14. College Station: StataCorp LP.
Streukens, Sandra, Martin Wetzels, Ahmad Daryanto, and Ko de Ruyter. 2010. Analyzing factorial data using PLS: Application in an online complaining context. In: Handbook of partial least squares: Concepts, methods and applications (Springer Handbooks of Computational Statistics Series, vol. II), eds. Esposito Vinzi, V., Chin, W.W., Henseler, J., Wang, H., 567–587. Heidelberg: Springer.
Temme, Dirk, Marcel Paulssen, and Till Dannewald. 2008. Incorporating latent variables into discrete choice models: A simultaneous estimation approach using SEM software. BuR - Business Research 1: 220–237.
Tenenhaus, Michel. 2004. A PLS approach to multiple table analysis, 607–620., Classification, clustering, and data mining applications Berlin: Springer.
Train, Kenneth E. 2009. Discrete choice methods with simulation. Cambridge: Cambridge University Press.
Willaby, Harold W., Daniel S.J. Costa, Bruce D. Burns, Carolyn MacCann, and Richard D. Roberts. 2015. Testing complex models with small sample sizes: A historical overview and empirical demonstration of what partial least squares (PLS) can offer differential psychology. Personality and Individual Differences 84: 73–78.
Wold, Herman O.A. 1982. Soft modeling: The basic design and some extensions. In Systems under indirect observations: Part II, ed. K.G. Jöreskog and H.O.A. Wold, 1–54. Amsterdam: North-Holland.
Zhang, Jing, F. Reed Johnson, Ateesha F. Mohamed, and A. Brett Hauber. 2015. Too many attributes: A test of the validity of combining discrete-choice and best–worst scaling data. Journal of Choice Modelling 15: 1–13.
Acknowledgements
The authors would like to acknowledge the assistance of Jordan J. Louviere, Ingo Bentrott and Timothy M. Devinney in the collection of the data that is used in this study, and the constructive inputs of Christine Eckert. This article uses the statistical software SmartPLS 3 (http://www.smartpls.com). Ringle acknowledges a financial interest in SmartPLS. Gudergan also acknowledges the support provided by the Australian Research Council (ARC LP0455822).
Author information
Authors and Affiliations
Corresponding author
Additional information
Publisher’s Note
Springer Nature remains neutral with regard to jurisdictional claims in published maps and institutional affiliations.
Appendix
Rights and permissions
Open Access This article is distributed under the terms of the Creative Commons Attribution 4.0 International License (http://creativecommons.org/licenses/by/4.0/), which permits unrestricted use, distribution, and reproduction in any medium, provided you give appropriate credit to the original author(s) and the source, provide a link to the Creative Commons license, and indicate if changes were made.
About this article

Cite this article
Hair, J.F., Ringle, C.M., Gudergan, S.P. et al. Partial least squares structural equation modeling-based discrete choice modeling: an illustration in modeling retailer choice. Bus Res 12, 115–142 (2019). https://doi.org/10.1007/s40685-018-0072-4
Received:
Accepted:
Published:
Issue Date:
DOI: https://doi.org/10.1007/s40685-018-0072-4