
Abstract
This article describes a new method of providing feedback during a brain–computer interface movement task using a non-invasive, high-resolution electrotactile vision substitution system. We compared the accuracy and movement times during a center-out cursor movement task, and found that the task performance with tactile feedback was comparable to visual feedback for 11 participants. These subjects were able to modulate the chosen BCI EEG features during both feedback modalities, indicating that the type of feedback chosen does not matter provided that the task information is clearly conveyed through the chosen medium. In addition, we tested a blind subject with the tactile feedback system, and found that the training time, accuracy, and movement times were indistinguishable from results obtained from subjects using visual feedback. We believe that BCI systems with alternative feedback pathways should be explored, allowing individuals with severe motor disabilities and accompanying reduced visual and sensory capabilities to effectively use a BCI.
Export citation and abstract BibTeX RIS
1. Introduction
A brain–computer interface (BCI) uses recorded brain activity to bypass the standard neuromuscular output pathways, enabling people with neurological disease or damage to interact with external devices for communication or movement. The most prevalent BCI system records electroencephalogram (EEG) from the user's scalp, who is trained to voluntarily modulate brain activity in order to control the prosthetic. Many recent studies have demonstrated multi-dimensional (1D, 2D and 3D) cursor control and the ability to use a virtual keyboard for typing [1–5].
In nearly all current BCI systems, visual feedback is the primary mean of giving the user an indication of their task performance. The application (e.g., virtual control of a computer cursor or a spelling application) is displayed on a computer monitor, requiring nearly constant attention in order to use the device. However, people with neurological disorders such as amyotrophic lateral sclerosis (ALS) or brainstem stroke may lack the muscle strength to consistently orient their head and eyes towards the computer screen for a extended period of time, and those with decreased visual acuity may not be able to use a computer monitor at all. Therefore, an alternative information channel is needed to provide these users with closed-loop feedback from the neuroprosthesis. A few recent studies used vibrotactile feedback on the trunk or arms to provide sensory feedback during a BCI task [6, 7]. In both cases, although the subjects were able to perform the task to some degree, the tactile acuity on the skin proved to be insufficient to consistently provide detailed information about the task, given that the two-point discrimination of the forearm, belly, and shoulder are 35, 30 and 40 mm, respectively [8]. Additionally, users with conditions such as spinal paralysis may have reduced or absent limb and trunk sensation, eliminating vibrotactile feedback as an option entirely.
Recent studies have suggested that the tongue may be a suitable interface for providing sensory information to the brain [9–12]. In these studies, the tongue was stimulated with an array of electrodes, providing information about a deficient or missing sensory modality, such as balance or vision. In the balance studies [13–15], individuals with vestibular deficiencies were equipped with a head-mounted accelerometer system that provided postural information, which was then fed back to the user through the tongue stimulation system. The tongue was stimulated in a pattern corresponding to the direction of acceleration, allowing the user to self-correct if their upper body began drifting in an unstable manner, and thus supplementing or replacing the remaining vestibular system. Similarly, a vision substitution system was designed in which video was captured with a head-mounted camera, and down-sampled to be displayed on an array of electrodes on the tongue [16]. Therefore, different sensory modalities were conveyed through the same tongue interface via electrotactile stimulation of the tongue. The tongue is highly innervated with several cranial nerves and has two-point discrimination threshold between 1.6 and 2.6 mm [17], and thus provides an ideal high-density interface for electrotactile feedback.
In the study presented, such an alternative feedback pathway adapted for a BCI system is presented. A center-out cursor movement task was modified so that both the target and cursor were displayed simultaneously on the tongue. To move the cursor, subjects used motor imagery of the hands and feet to volitionally modulate the mu and beta EEG rhythms over sensorimotor cortex, which were translated into cursor velocity. Most of the subjects had previously been trained on the task using visual feedback. Additionally, one blind subject also participated in this study using only tactile feedback. After a short training period, all subjects were able to perform the BCI cursor movement task in both the horizontal and vertical directions with tactile feedback at a level comparable to that obtained with visual feedback after several sessions.
2. Methods
2.1. Participants
A total of eleven subjects participated in this study at the University of Wisconsin–Madison. Of these, ten had no motor or visual disabilities. One subject had congenital blindness with an onset at birth. The study was approved by the UW Human Subjects IRB committee, and all subjects gave informed consent.
2.2. Materials
The materials consisted of an EEG acquisition system (TDT RZ2), the tongue display system (TDU), and a PC running BCI2000.
2.2.1. EEG acquisition
EEG was acquired using a TDT RZ2 system (Tucker–Davis Technology, Alachua, FL). Each channel was sampled at 24.4 kHz, bandpass filtered from 3 to 30 Hz, and down-sampled 23 times to 1061 Hz. A low-pass filter cutoff frequency of 30 Hz was used to block stimulus artifacts that could be seen at the scalp, but still allow the measurement of the appropriate sensorimotor rhythms up to 25 Hz. A 16 or 36-channel cap (modified 10–20 system) from Electro-Cap International (Eaton, OH) was used for data acquisition; electrodes were grounded to Fpz, and referenced to an ear electrode. All electrode-scalp impedances were kept below 3 kΩ. Data acquisition, online signal processing, and task presentation were controlled using custom software developed with the BCI2000 platform on a PC running Windows XP [18].
2.2.2. Tongue display system
The tongue-display unit (TDU) used in this study has been described in detail in previous studies [19, 20, 11]. It consists of a signal generator that controls the voltage output, a flexible connector cable, and the electrode array. The array is arranged in a 12×12 grid, which is further divided into four 6×6 quadrants. Subjects placed the array on their tongue, making sure that the array is centered and in full contact with the tongue surface (figure 1). The system has operational limits of 27 V on the tongue with a 2 kΩ load, and 40 V on dry skin with a 20 kΩ load, and coupling capacitors at the output in series with the electrodes ensure zero net dc current to minimize the potential for tissue irritation.
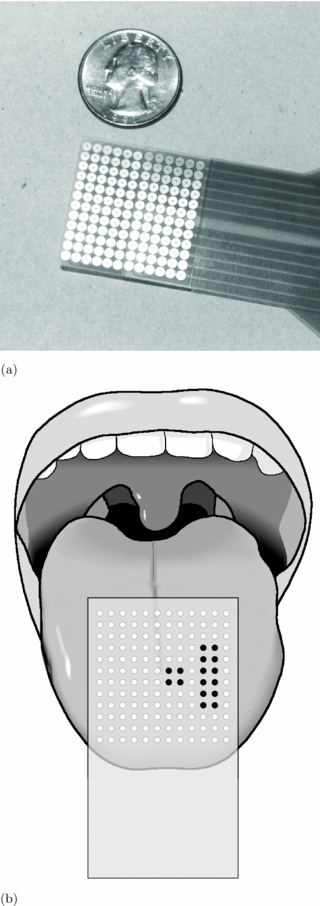
Figure 1. The size and placement of the tongue display unit (TDU). (a) TDU array. (b) Array placed on tongue.
Download figure:
Standard imageFigure 2 demonstrates the timing characteristics of waveforms for several channels, which are summarized in table 1. Within a quadrant, tactors were stimulated for 20 μs, termed the tactor pulse width (PW); the interval between stimulus onsets within a quadrant is the tactor interstimulus interval (TISI) and was 138 μs. Therefore, within a quadrant, the maximum total stimulus duration (or burst duration) from the onset of channel 1 to the onset of channel 36 in each quadrant was 4.98 ms. The BCI system processes data and updates the display every 30 ms. Therefore, the period between bursts (burst interval) was 30 ms, so that every TDU pulse corresponds to one BCI refresh period.
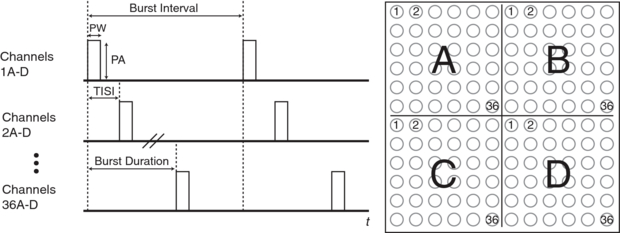
Figure 2. The timing characteristics of each channel on the array. The pulse amplitude (PA), pulse width (PW), tactor inter-stimulus interval (TISI), burst duration and burst interval are shown. The onset of the first channels are synchronized in each quadrant.
Download figure:
Standard imageTable 1. TDU parameters.
| Parameter | Value |
|---|---|
| Contact layout | 12×12 |
| Contact diameter | 2.13 mm |
| Contact C–C distance | 2.34 mm |
| Peak amplitude (PA) | 40 V |
| Amplitude resolution | 156 mV |
| Tactor pulse width (PW) | 20 μs |
| Tactor ISI (TISI) | 138 μs |
| Burst duration | 4.98 ms |
| Burst interval | 30 ms |
Stimuli are delivered on single channels at any given time within a quadrant for two reasons. First, it is impractical to design a system with 144 individually controllable voltage sources. Therefore, by using a raster scan system in conjunction with fast update periods, only one voltage source is required per quadrant. Second, during a scan, the other 35 inactive electrodes act as the return path for the stimulus current, eliminating the need for additional ground electrodes on the array.
2.2.3. TDU latency
The output latency of the TDU was measured to determine the delay between the time that a device command was issued in the program to the time when the corresponding change in the TDU display is updated. The minimum output delay from the device command to stimulation onset was 15 ms, which incorporates the transmission to the serial interface operating at 115 kHz and the micro-controller that interprets the commands. Furthermore, the stimulus waveform does not change until the current burst is complete. Since the burst duration is 30 ms, there is a theoretical maximum delay of 45 ms in the worst case (e.g., the update command is processed immediately following the burst onset), and just 15 ms in the best case (e.g., the update command is processed immediately preceding the burst onset).
2.2.4. Vision substitution
During trials using tactile feedback, the contents of the computer screen were encoded and presented on the electrode array, as illustrated in figure 3. To differentiate the cursor from the targets, the amplitude targets sites were 10 V, and the amplitude of the tactors for the cursor were a maximum of 20 V. At the start of the each trial, a target appeared at the left, right, top, or bottom of the field, occupying 10% of the screen; the target was present for 1s before the cursor appeared. Once the cursor reached the target, the amplitude of the target increased to 25 V (or the maximum comfortable level, whichever was smaller). A trial was counted as a hit if the cursor remained within the target for 500 ms, and was aborted after 8 s.
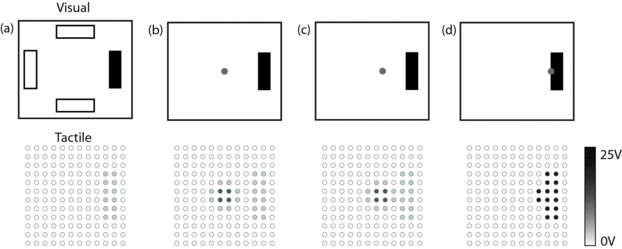
Figure 3. The screen to tongue array encoding scheme. (a) Targets appear in one of four locations of the field. (b) After 2 s, the cursor appears in the center. (c) The cursor is moved to the current target. (d) The amplitude of the target and cursor increases when dwelling. After dwelling 500 ms, the target is selected.
Download figure:
Standard imageThe amplitude of the active cursor tactors were calculated using an exponential decay as a function of the distance of each tactor (which have discrete locations) to the cursor location (a continuous floating-point value) (figure 4):


where xt and yt are the discrete coordinates of a tactor, xc and yc are the current floating-point coordinates of the cursor, k is the decay constant, and Vt is the resulting voltage of the tactor. The constant k was set to 1.5, which provided a detectable cursor diameter of about four tactors. Multiple tactors were used to provide a sense of a continuous cursor position, instead of a discrete position, and tactors further than two positions away from the 'real' cursor position were near the sensory threshold for much of the tongue. Therefore, the highest amount of stimulation occurred within a diameter of two tactors, and decayed quickly, allowing precise tactile localization and non-discrete cursor positioning. Finally, the position of the cursor on the screen, not on the tongue array, was used for collision detection to indicate when the cursor was within the target, even in trials in which the monitor was not used.
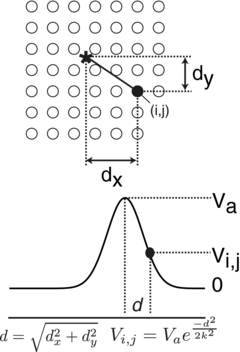
Figure 4. The amplitude (Vi, j) of electrode (i, j) is determined by the distance (d) of the electrode from the actual cursor position, shown here as ⋆. The cursor position is a continuous floating-point value, whereas the electrode locations are fixed; that is, the center of the cursor is interpolated between all of the electrode positions.
Download figure:
Standard image2.3. Experimental design
Subjects performed two core tasks during a session: a reaction time test and the BCI test. The reaction time test compared visual and tactile reaction times to determine if any discrepancy in BCI task performance using different feedback modalities could be attributed to differences in reaction time. The BCI task consisted of three phases: (1) open-loop motor imagery; (2) motor imagery-driven cursor movement with visual feedback; and (3) motor imagery-driven cursor movement with tactile feedback.
Each session lasted 1 h. For the first session, the subject performed the reaction time task, which lasted up to 10 min, described in detail below. The reaction time task was not performed in subsequent sessions. Next the subject performed used open-loop motor imagery in response to cues displayed on the computer screen. An arrow pointing left, right, up, or down cued the subject to imagine moving their left hand, right hand, both hands, or feet, respectively. Each cue wad displayed for 3 s, and were repeated 25 times with an inter-stimulus interval of 3 s. This data was analyzed offline to determine appropriate control features for each electrode for the closed-loop cursor movement task.
Next, the subject performed the cursor movement task. As in the open-loop task, mental imagery of movement was used to direct the cursor left, right, up, or down. During the first session, subjects did not use the TDU for feedback, but they were introduced to the concept. In subsequent sessions, visual and tactile feedback test runs were interleaved throughout the session. Details about the BCI tasks are described in detail below.
2.3.1. Sensitivity thresholds
Due to the high degree of tongue innervation, there may be inconsistencies in the sensation magnitude based on the stimulus location and parameters (e.g., pulse width, inter-pulse interval, amplitude, etc), and the effects that these parameters have on the type and density of tactile receptors. For example, FA-I and SA-I mechanoreceptors have small receptive field size, and are densely packed at the tip of the tongue. Receptor densities are lower around the perimeter of the tongue, and are lowest at the posterior and midline. However, the electrode array that was used spans all of these regions, which can lead to significant perceived differences in sensation intensity and threshold for identical stimulus waveforms at different electrode locations.
In a separate study [21], the sensitivity thresholds for different regions of the tongue were found in seven subjects, none of whom participated in the current study (figure 5). During a session, the sensitivity threshold was determined by instructing the subject to increase the amplitude on the TDU until the stimulus was barely perceptible. The sites were chosen at random, with the condition that consecutive electrodes must be separated by at least two electrodes, to minimize adaptation or habituation to the stimulus. All 144 electrodes on the array were tested three times per session, and each subject participated in two sessions, for a total of six measurements per electrode. This data was used to create a generic sensitivity map so that the amplitude on a given electrode could be scaled for the location on the tongue normalized to the lowest threshold. The front of the tongue near the midline had the lowest threshold, generally about 2 V, while the back of the tongue at the midline had a much higher sensory threshold of about 7 V. Individual differences in sensation threshold for a single electrode in that study had a coefficient of variance (CV) of as much 39%, particularly at the poster-medial region of the array, whereas within subject variability was uniformly very low (CV < 8%). Therefore, electrodes towards the front of the tongue (which is more sensitive) was normalized to 1, while electrodes on the back of the tongue required a higher amplitude to elicit a response, and had a gain of about 3 in some locations.
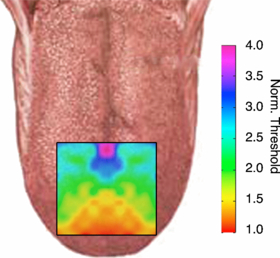
Figure 5. Normalized mean tongue threshold map of seven subjects.
Download figure:
Standard image2.4. Tongue sensitivity
The normalized and averaged threshold map for seven subjects from a different study is shown in figure 5. Based on these results, a normalization map based on figure 5 was developed for use during the BCI task. The electrode amplitudes were normalized to the electrode with the highest threshold, e.g., near the tip of the tongue.
This information was used to construct a sensory threshold compensation matrix, in which the desired amplitude of a single electrode is transformed based on its location on the tongue. For example, a 1 V stimulus on the front of the tongue might be transformed into a 3.5 V stimulus on the back of the tongue, so that the perceived intensity of the two stimuli would be approximately the same. It was important to consider the variation in perceived intensities in the current study, because the stimulus amplitude encoded task-related information (e.g. the cursor and target patterns were presented with different amplitudes).
2.4.1. Reaction time
A reaction time test was performed during the subject's first session. The reaction times for visual and tactile stimuli were compared by instructing the subject to press a button in response to the particular stimulus presented. The visual stimulus was a white rectangle that flashed on the screen for 30 ms. During the tactile stimulus, the entire tongue array was 'flashed' at 25 V for 5 ms (1 burst). Each stimulus modality was tested independently, i.e. visual and tactile stimuli were not interleaved concurrently within a sequence to avoid potential confusion and delay. The random inter-stimulus interval was between 1–2 s to prevent anticipation, and each stimulus modality was presented 100 times.
To accurately record the time at which the visual stimulus appeared, a photodiode was attached to the monitor over the stimulus area, and input to a stimulus detection box (g.TRIGbox, g.tec, Austria) that generates a digital pulse when a stimulus exceeds a pre-determined threshold. The TDU stimulus onset was measured from a digital pulse on the TDU coincident with stimulus onset. The button press, visual stimuli events and TDU stimuli events were recorded with the EEG amplifier, and used to determine the time difference between a tactile or visual stimulus and corresponding button press with sub-ms resolution. The reaction time for either stimulus was measured as the onset of the button press minus the onset of the stimulus.
Visual reaction times are typically between 180–200 ms while tactile reaction times are typically about 155 ms [22, 23]. In this study, all reaction times less than 120 ms were removed from the analysis; the earliest conscious responses to stimuli occur at 100 ms, and faster responses were assumed to be due to the subject anticipating, rather than reacting to, the stimulus [24, 25]. Since BCI2000 used a refresh rate of 30 ms, the 120 ms threshold was chosen as the closest multiple to 100 ms.
2.4.2. Brain–computer interface task
All sighted subjects had already been trained to voluntarily modulate mu (8–12 Hz) and/or beta (15–30 Hz) rhythms by employing motor imagery with visual feedback of task performance during at least one previous session [26–28]. Changes in these power bands on electrodes covering sensorimotor cortex (C3, CP3, C4, CP4, Cz, and CPz) were translated into horizontal or vertical velocity in a center-out cursor control task using a linear classifier. First, a common-average reference was applied to the EEG signals. Then, the power spectral density of every EEG channel was computed using an auto-regressive model every 30 ms using a 510 ms window. The mean amplitudes in selected frequency bands were weighted and summated over all channels to construct a single control value; for example, values on the C3 electrode were weighted to move the cursor right, and those on C4 to the left, for the horizontal movement task. The instantaneous control signal was normalized to the mean of the accumulated control signal; this mean value was updated after every run. The same features and channels were used for both feedback modalities.
During a trial, subjects were asked to move the cursor to one of four targets along either the X or Y axis, as shown in figure 3; full 2D control was not used in this study, i.e. the cursor movement was restricted to either the horizontal or vertical axis. Additionally, 5/11 subjects performed only horizontal cursor movement, due to their difficulty in achieving vertical cursor movement during the visual feedback task; these subjects were unable to consistently elicit the necessary EEG changes on the Cz electrode related to imagined foot movement. Upon reaching the target, the subject held the cursor within the target for 500 ms to 'select' it and successfully complete the trial. It was possible for the cursor to overshoot the target, requiring the subject to move it back in the opposite direction. Additionally, if the cursor hit the edge of the screen, it stopped moving while remaining visible. Each target was displayed for at most 8 s, with an inter-stimulus interval of 2 s. The cursor velocity gain was adjusted for each individual subject to a level with which they felt comfortable, i.e. it was not too fast for fine control for the dwell period, but not too slow to prevent movement within the trial time limits.
After achieving consistent accuracy of >75% with visual feedback, over the course of at least 1.5 sessions, subjects then used the tongue-display system with the monitor turned off. The frequency bins and channels chosen for control using visual feedback were maintained during tactile feedback, to account for potential differences in EEG topography during the two tasks.
3. Results
3.1. Reaction times
The reaction times for all ten subjects is shown in figure 6. The skewness of the reaction times for each subject was within ±0.1, indicating a highly normal distribution. The visual and tactile reaction times for each subject were compared. All but two subjects (A135 and A151) had visual reaction times that showed no statistical difference with the tactile reaction times (Student's t-test, p > 0.05 in all cases except A135 and A151 each with p < 0.01). The mean visual reaction time for all subjects was 200 ms, and the mean tactile reaction time was 219 ms, a difference of 19 ms. A Student's t-test between the reaction times of all subjects showed no significant difference (p = 0.09).
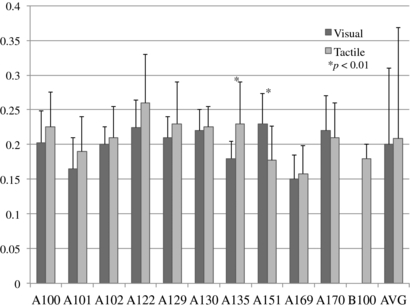
Figure 6. Visual and tactile reaction times for all subjects. Standard deviation error bars are shown.
Download figure:
Standard image3.2. Accuracy and movement times
Table 2 shows the accuracy and movement times for cursor movement trials with visual and tactile feedback. All values shown were taken from the subject's last session, and include 50 trials for all four targets for a total of 200 trials for each feedback condition. The skewness of the movement times for each subject was within ±0.1, indicating a normal distribution. In all six subjects that performed both vertical and horizontal movement, there were no significant differences in the accuracy or movement times for any condition (p < 0.01), despite variability in the tongue sensitivity, particularly at the back of the tongue. We believe this is due to the increased pulse amplitude that compensated for the decreased sensitivity.
Table 2. Accuracy and movement times for 200 trials.
| Accuracy | μ ± σ movement times (s) | ||||
|---|---|---|---|---|---|
| Subject | V | T | V | T | Student's p value |
| A100 | 52% | 62% | 2.17 ± 1.62 | 2.65 ± 2.23 | <0.01 |
| A101a | 94% | 68% | 3.00 ± 2.39 | 2.47 ± 1.95 | <0.01 |
| A102a | 92% | 86% | 1.67 ± 1.71 | 1.63 ± 1.37 | 0.71 |
| A122 | 77% | 63% | 2.14 ± 1.65 | 1.99 ± 2.14 | 0.07 |
| A129a | 76% | 70% | 3.69 ± 2.89 | 2.37 ± 1.88 | <0.001 |
| A130 | 84% | 80% | 2.78 ± 2.06 | 1.88 ± 1.39 | <0.001 |
| A135a | 75% | 85% | 4.63 ± 1.75 | 3.20 ± 1.56 | <0.001 |
| A151 | 86% | 79% | 2.67 ± 1.75 | 3.62 ± 2.43 | <0.001 |
| A169a | 82% | 78% | 3.18 ± 2.44 | 4.12 ± 2.98 | <0.001 |
| A170a | 88% | 85% | 4.58 ± 2.73 | 2.77 ± 1.97 | <0.001 |
| B100 | 75% | 2.36 ± 1.45 | |||
| All | 80.6% | 75.6% | 2.51 ± 2.02 | 2.37 ± 2.10 | 0.21 |
aIncludes horizontal and vertical control, otherwise only horizontal control.
The average cursor gain, G, expressed as the number of seconds required to move the cursor the width or height of the screen, was 1.25 s, and ranged from 0.75 to 2 s. Therefore, all movement times were scaled by 1.25/G, so that a meaningful comparison of the times could be made between subjects. The times shown include the 500 ms dwell period, which accounted for a significant portion of the overall movement time. Additionally, the subject may have moved the cursor to the target very quickly, but took several seconds before keeping the cursor within the target for the specified time. Finally, if the trial was not complete after 8 s, it was counted as a miss, and not included in the average movement time.
A Student's t-test was used to compare the movement times for the visual and tactile feedback methods within subjects to determine whether there was a significant difference between them, with the null hypothesis that the movement times for each were from the same distributions. For eight subjects, p < 0.01 indicating that the feedback modality used had a significant effect on the movement time. Of these, five subjects had faster movement times with tactile feedback, and three had faster times with visual feedback. The blind subject had an overall accuracy and movement time significantly similar to the other subjects (75% accuracy compared to 75.6% accuracy, and 2.36 ± 1.45 s movement time compared to 2.37 ± 2.10). Over all subjects, there was no significant difference between the two feedback modalities (p = 0.21), although the overall accuracy was slightly smaller for tactile feedback (75.6%) than for visual feedback (80.6%).
3.3. Learning and skill transference
Previously trained subjects showed virtually no transition period in which they 're-learned' the task; that is, with minimal training, there was a nearly instantaneous skill transference from visual feedback to tactile feedback (figure 7(A)). The mean accuracy for all subjects on the first set of 20 trials was variable, at 64% ± 25%. The mean accuracy increased over the session to 80% ± 10% for the last 20 trials. Thus, all subjects increased their accuracy from their initial performances.
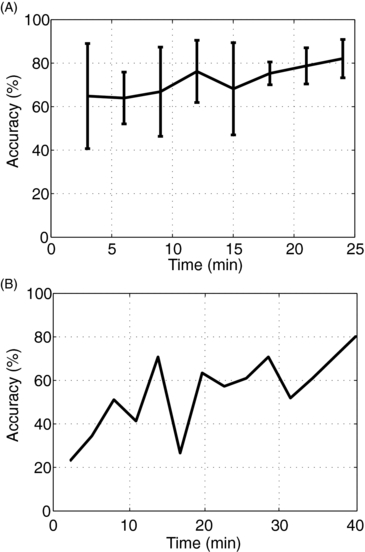
Figure 7. (A) The mean and standard deviation of the accuracies of all subjects versus time during the first session with tactile feedback. (B) The training time for the blind subject during the first session.
Download figure:
Standard imageThe learning rate for the blind subject is shown in figure 7(B). In this subject's first session, there were ten runs totaling 40 min of testing. During this initial session, the initial accuracy increased from 36.6% for the first 60 trials to 80% accuracy for the final set of 20 trials.
3.4. Control signal correlation and topography
Table 3 contains the frequency bins used for control, and the r2 of the control signals for visual feedback and tactile feedback. The coefficient of determination (r2, [29]) is a measure of the variability in the control signal that can be accounted for by the task. Here, the control signals were found for movement to the left and the right targets and were compared. The same control signals were used for all open-loop, visual, and tactile controls. For all subjects, the control signal had a high r2 for both visual and tactile feedback, and the values were close in magnitude regardless of the feedback modality used, and were comparable to previously published studies [30, 3].
Table 3. Control signal r2 for selected frequency bins during open-loop, visual, and tactile feedback.
| Subject | Frequency bins | Open-loop r2 | Visual r2 | Tactile r2 |
|---|---|---|---|---|
| A100 | 8–12 Hz, 24–28 Hz | 0.05 | 0.20 | 0.34 |
| A101 | 8–12 Hz | 0.10 | 0.34 | 0.25 |
| A102 | 10–14 Hz, 18–20 Hz | 0.19 | 0.38 | 0.41 |
| A122 | 8–10 Hz, 18–20 Hz | 0.22 | 0.33 | 0.34 |
| A129 | 10–12 Hz, 18–20 Hz | 0.08 | 0.28 | 0.22 |
| A130 | 16–18 Hz | 0.28 | 0.62 | 0.61 |
| A135 | 10–12 Hz | 0.06 | 0.25 | 0.57 |
| A151 | 8–12 Hz | 0.11 | 0.32 | 0.36 |
| A169 | 18–22 Hz | 0.04 | 0.18 | 0.16 |
| A170 | 8–12 Hz | 0.12 | 0.35 | 0.37 |
| B100 | 20–24 Hz | – | – | 0.44 |
Figure 8 shows the scalp topographies for six of the subjects during open-loop control (imagined movements with no feedback), visual feedback of cursor movement, and tactile feedback of cursor movement. The power in the frequency bins used for control was found on all channels, and the r2 between the left and right movement conditions were compared. For example, with subject A100 the mean power in the 8–12 and 24–28 Hz bins was found on all channels, even those not used for control, and the r2 was found for both movement directions. For several of the subjects shown (A100, A101, and A129), the open-loop imagined movements produces a very small r2 even over motor cortex, while large differences were seen during both tactile and visual feedback.
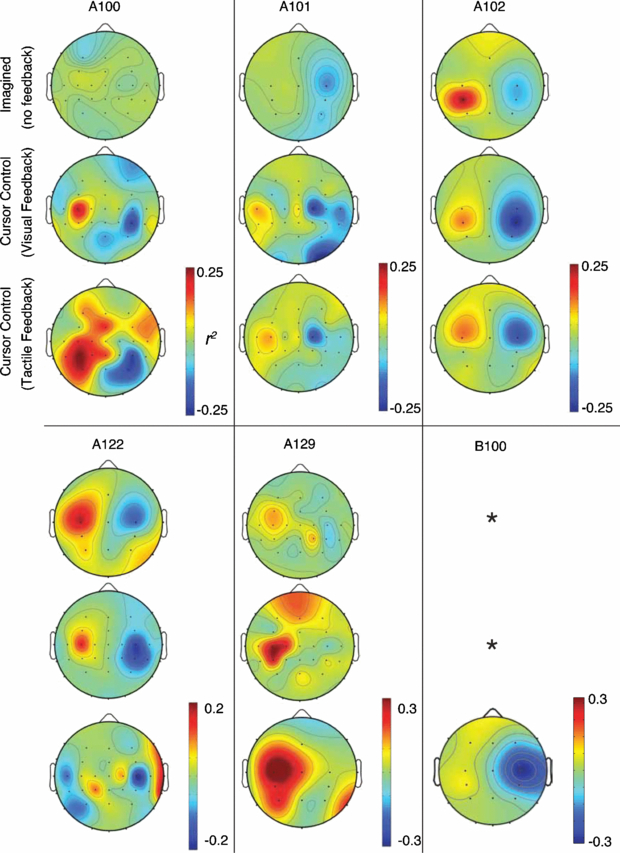
Figure 8. Scalp mean power r2 topographies for six subjects. *—data not collected for blind subject.
Download figure:
Standard imageDifferent activation patterns were seen between the visual feedback and tactile feedback topographies. In many, larger areas are active during tactile feedback than visual feedback (e.g., A100 and A129), or different electrodes are active (e.g., A122 and A130).
4. Discussion and conclusion
Based on the reaction times and performance during the task itself, the results in this study indicate that an electrotactile tongue interface would likely be suitable for people with poor visual control. In the worst case, the TDU updates the tongue 'display' within 45 ms (22.2 Hz), faster than the reaction times possible either visually or tactilely. In the best case, the tactile display was changed within 15 ms (66.6 Hz), potentially faster than an LCD monitor, which has a mean output delay of about 20 ms based our results from another study [31]. This would be more than sufficient for a low-bandwidth task with a time course of several seconds, such as cursor movement.
Two potential pitfalls of using electrotactile stimulation are stimulation artifacts in the EEG, and somatosensory rhythm modulation resulting from the stimulation. The first issue is addressed by the fact that the stimulation pulses are presented at a frequency of 30 Hz, while the EEG features of interest are typically in the 8–25 Hz range. Additionally, the EEG signals were bandpass filtered from 3–30 Hz to remove any high-frequency stimulus components in the signals. Finally, a common-average reference was applied to the EEG, which effectively removes any common components such as stimulus artifacts. The second issue, modulation of the somatosensory rhythms resulting from stimulation, is likely mitigated by the distance of the hand, arm and foot areas of motor cortex from the tongue sensory area. Any changes in these sensory rhythms in the tongue areas were sufficiently far enough away from the hand and arm areas so as to not contaminate the hand and arm EEG motor rhythms.
One of the most promising aspects of this research was the EEG activity during the tactile feedback task, compared to the visual task, as demonstrated both by figure 8 and table 3. In table 3, the r2 values for the control signals were very similar for both feedback modalities. Of particular interest are subjects A102 and A130, each of which were highly-trained, having participated in 8 and >20 BCI sessions respectively prior to this study. Subject A130 had a very high r2 of 0.62 when visual feedback was used, due to the long prior training period; similarly, the r2 with tactile feedback was nearly identical (r2 = 0.61), even though the number of sessions was much smaller in this case (this subject only participated in two tactile feedback sessions prior to terminating their participation). Furthermore, the open-loop r2 value of the control signal was 0.28, much lower than the other modalities despite much training. This suggests that the lingual-tactile feedback pathway is just as effective as the visual channel for the purposes of the given task. A similar conclusion can be drawn for the other subjects as well: with sufficient training, either feedback modality can be used for a closed-loop BCI.
Anecdotally, many subjects reported that the task difficulty did not change based on the feedback used, and several even preferred performing the experiment with tactile feedback. The most common reason provided was that it felt easier to move the cursor to the target, since it was 'closer', or had a shorter perceived movement distance. However, further studies would be required to determine the psychophysical aspects of electrotactile stimulation systems for visual substitution, which were not addressed in this study.
In order for brain–computer interfaces to be usable by more people with motor disabilities, alternative feedback pathways that do not rely solely on vision, such as that suggested in this study, must be researched. Several studies have shown that neurological disorders such as ALS or stroke can cause ocular abnormalities capable of reducing saccade velocity, altering smooth pursuit, and causing optokinetic nystagmus, even early in the progression of the disease [32–34]. The results of this study show that a tactile information channel is capable of providing the closed-loop feedback necessary to control a simple BCI.
However, several additional obstacles remain to implement such a system, most notably the mechanism for keeping the electrode array in the subject's mouth when they have little or no muscle control. Subjects in this study used their tongue and lips to keep the array in place, which a person with severe motor disabilities would likely have great difficulty accomplishing. An oral retainer, similar to that designed in [15], will likely be needed for such users. However, practical implementation of this device has already been realized in small, portable devices targeted for specific applications. For example, the BrainPort Balance DeviceTM that has been demonstrate to be clinically efficacious in treating a broad array of vestibular-based balance disorders [13, 11], and the BrainPort Vision substitution system is for use by individuals that are low-vision or blind [16, 35]. The core technology has more recently been evolved neurostimulation device for use in symptomatic treatment of neurological disorders, including traumatic brain injury, multiple sclerosis, Parkinson's disease and stroke [36–38].
It is also unknown how well subjects with a sudden onset of physical disabilities, including poor vision, would be able to learn to use this system. Both blind and sighted subjects learned to use tactile feedback for controlling a BCI very quickly, so there is little reason to believe that this would not hold true for those with motor disabilities, assuming the sensory fibers innervating the tongue remain unaffected. In the current study, a direct comparison of blind subjects and sighted subjects cannot be done due to differences in training methods; both groups would need to train using the TDU immediately without visual feedback to compare results. Therefore, a complete study enrolling subjects with motor disabilities and visual impairments is necessary to determine the long-term utility of this system.
Due to its non-invasive nature, the approach described here also allows for long-term longitudinal studies in human subjects, both with and without a variety of sensory and motor deficits. This opens the door for the investigation of plasticity as it relates to both task related learning as well as the role of neural adaptation over lengthened exposure to task algorithms. We speculate that the tight coupling of the tongue interface, and relatively short neural pathways involved in the tongue sensory system [39], allows precisely timed feedback, which is known to be crucial for driving neural plasticity in sensory-motor feedback paradigms [40]. The non-invasive nature of tongue stimulation provides an ideal platform for studying sensory motor feedback in both normal subjects and ones with sensory and motor deficits. As our preliminary evidence suggest, even subjects without an intact visual pathway, which is often the dominate feedback in BCI paradigms, can utilize this interface. Though the tongue feedback interface clearly does not rival the richness of a visual interface (i.e. lacking color depth), it may provide enough information to be used during the investigation of the effects of multiple simultaneous sensory feedback pathways. Further work needs to be done (i.e. different stimulation waveforms) to fully explore the capabilities of the tongue interface. Since the tongue contains a multitude of various types of sensory fibers (taste, temperature, mechanoreceptors), it may be possible to elicit a much wider range of sensory perceptions than could be obtained from electrical stimulation of other afferent feedback pathways.
In conclusion, a novel sensory feedback method was presented that allowed subjects, including one blind subject, to use a closed-loop BCI system without visual or auditory feedback. While there is still significant work to be done in developing a complete and robust solution for people with severe motor disabilities, the results from this study suggest that this is a worthwhile area of research to pursue for those potential BCI users unable to use the standard visual feedback pathway.